
Performance that holds up in a meeting.
Executive summary
This is the top-line view for buyers and partners: what changes, what stays stable, and what the data says. For a single-file handoff, download the full graph pack: Download PDF pack


Offerings: tiers and cell grades
Commercially, you’re buying a package: usable energy tier + cell grade. That keeps quoting clean and keeps expectations aligned.
| Offering | Usable energy | Primary objective | Typical buyer profile |
|---|---|---|---|
| Saver | ~7 kWh usable energy target |
Reliability-first at minimum total cost | “Get my Volt back on the road and keep it there.” |
| Standard | ~14 kWh usable energy target |
Balanced daily-driver performance | “I want OEM-like behavior with modern cells.” |
| Extended | ~28 kWh usable energy target |
Maximum EV miles / headroom | “I want the biggest swing in electric-only driving.” |
| Cell grade | Commercial posture | Engineering intent |
|---|---|---|
| Bargain | Cost‑first | Lowest capex. Appropriate when power headroom is not the driver. |
| Standard | Balanced | Best value: stable delivery, sensible thermals, strong lifecycle economics. |
| Elite | Performance‑first | Highest power capability and best thermal posture — the “no excuses” option. |
Compatibility target: 2011–2015 Chevy Volt and 2014–2016 Cadillac ELR. Actual usable energy varies by configuration and calibration.
Technical appendix (all graphs)
This is the full evidence set. Click any image to zoom. The structure below is organized for fast review during quoting and technical due diligence.
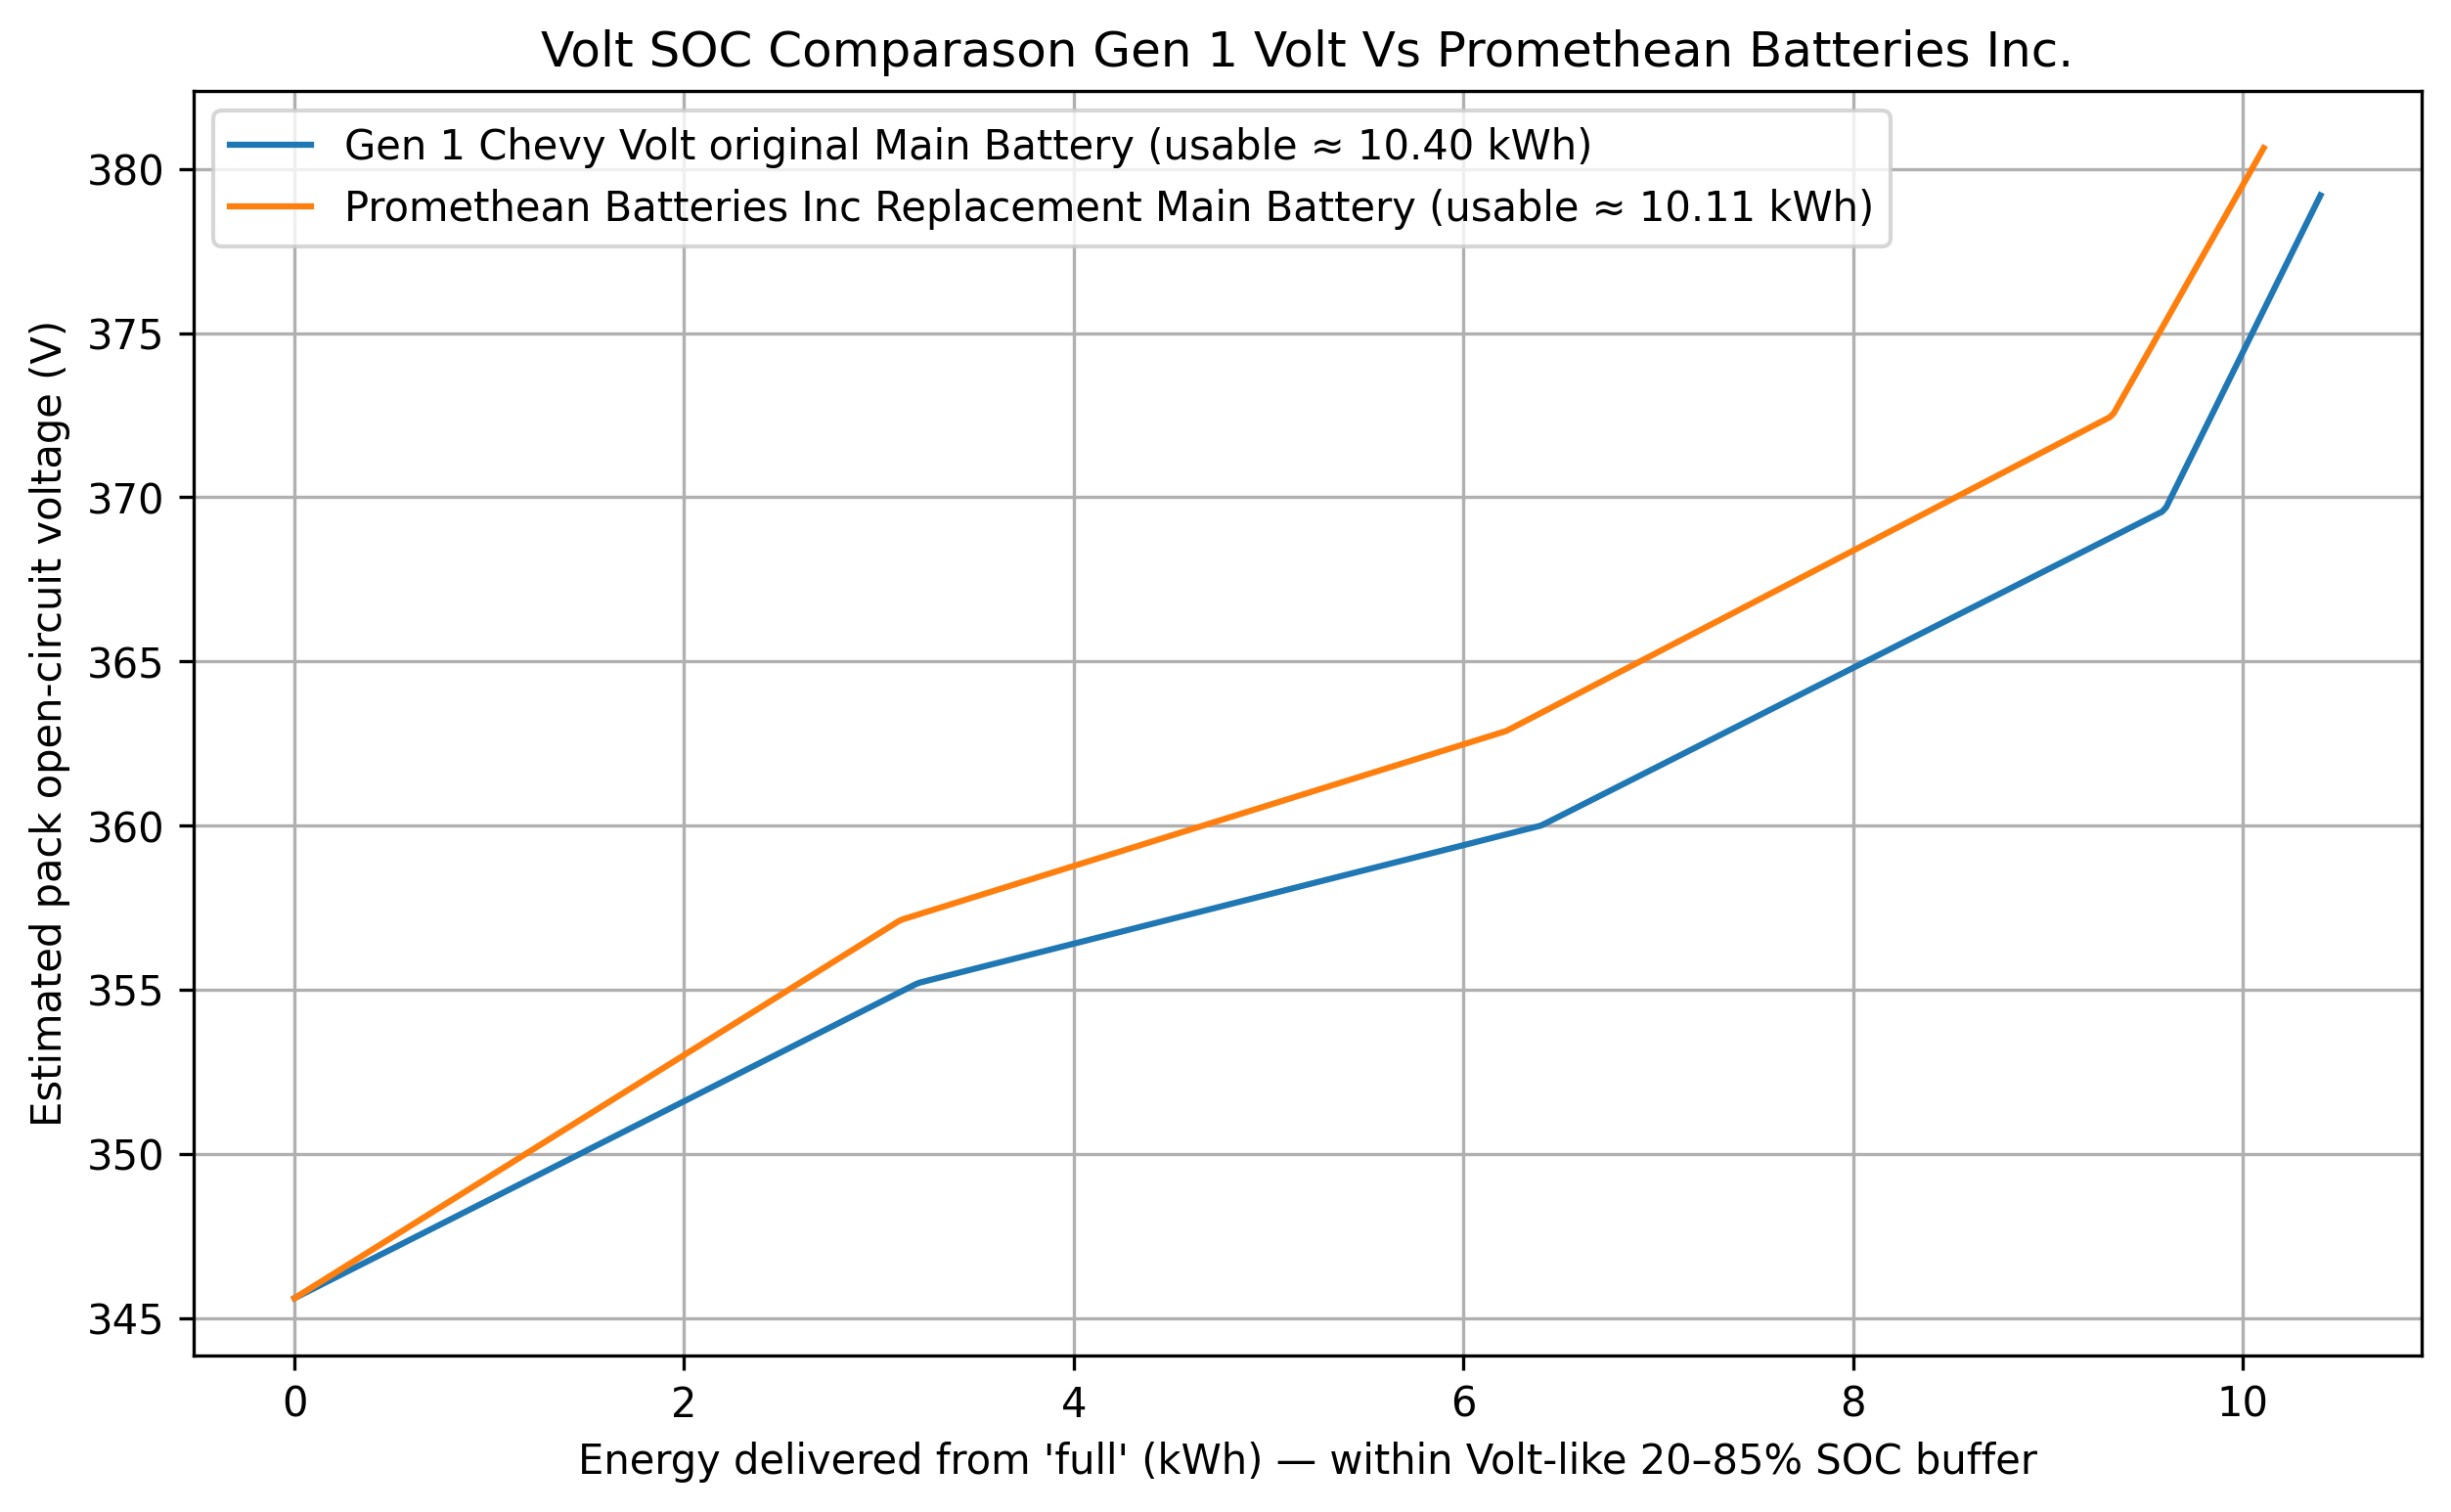
Baseline & integration
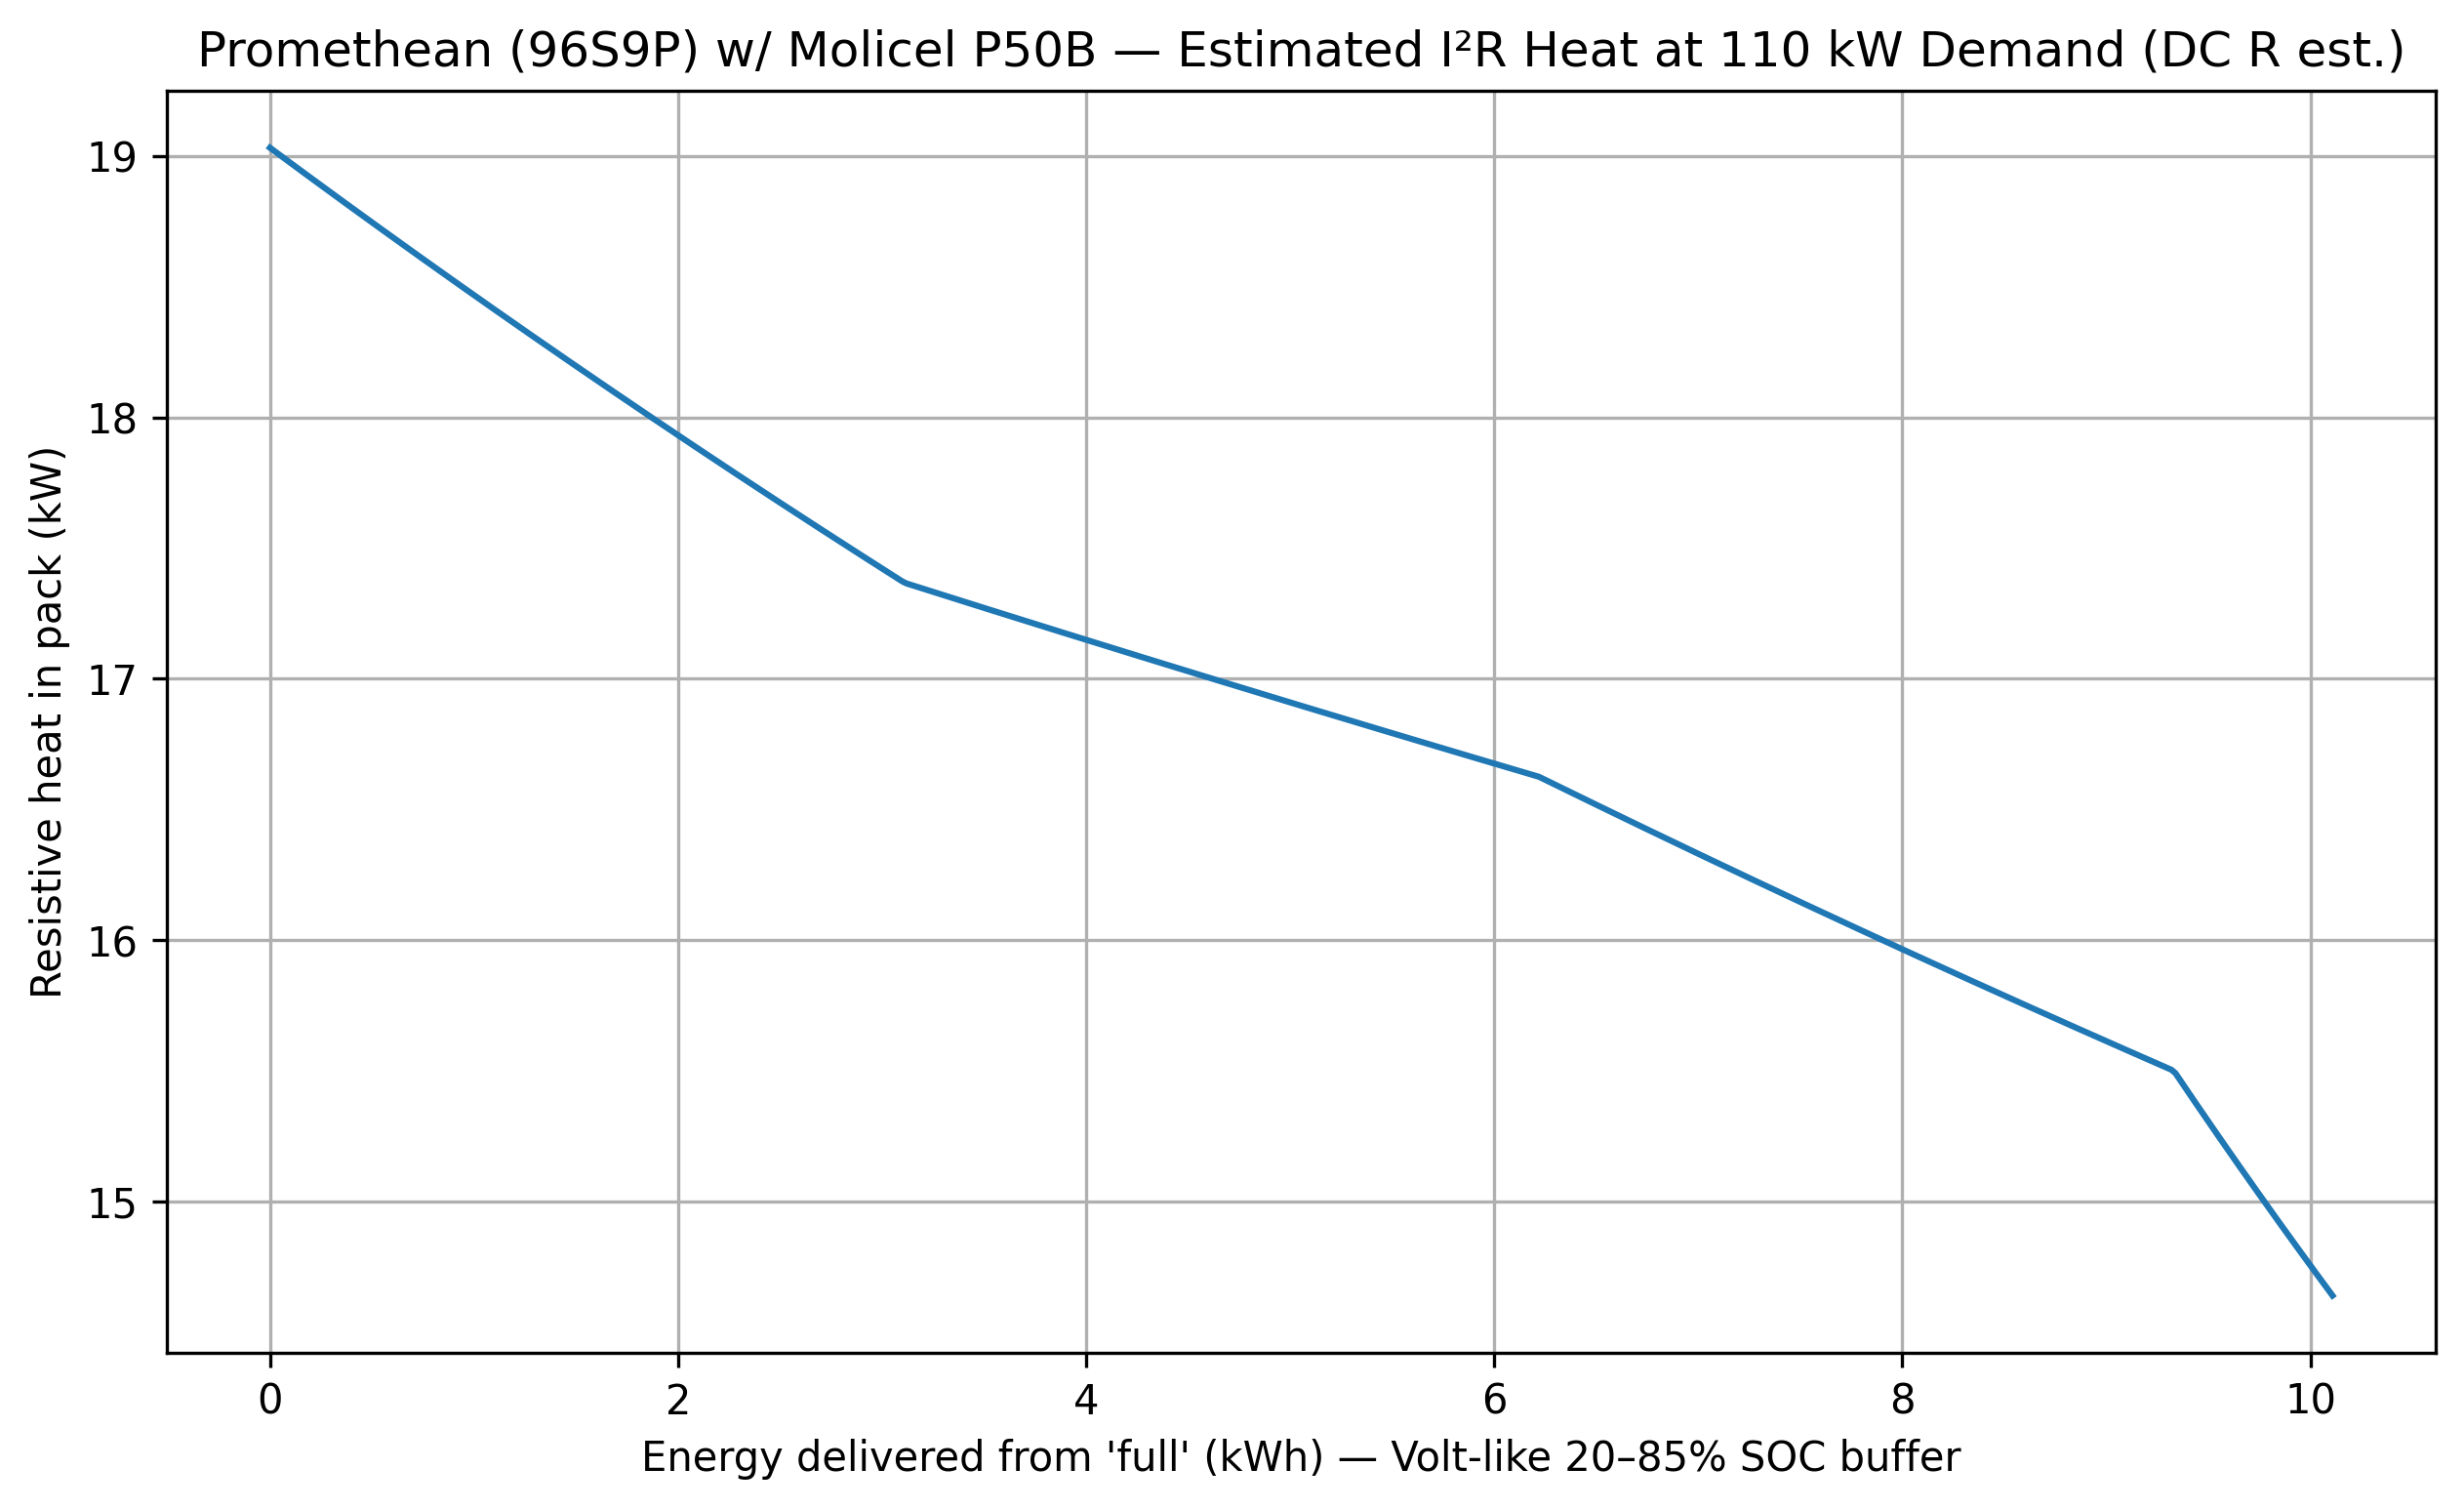
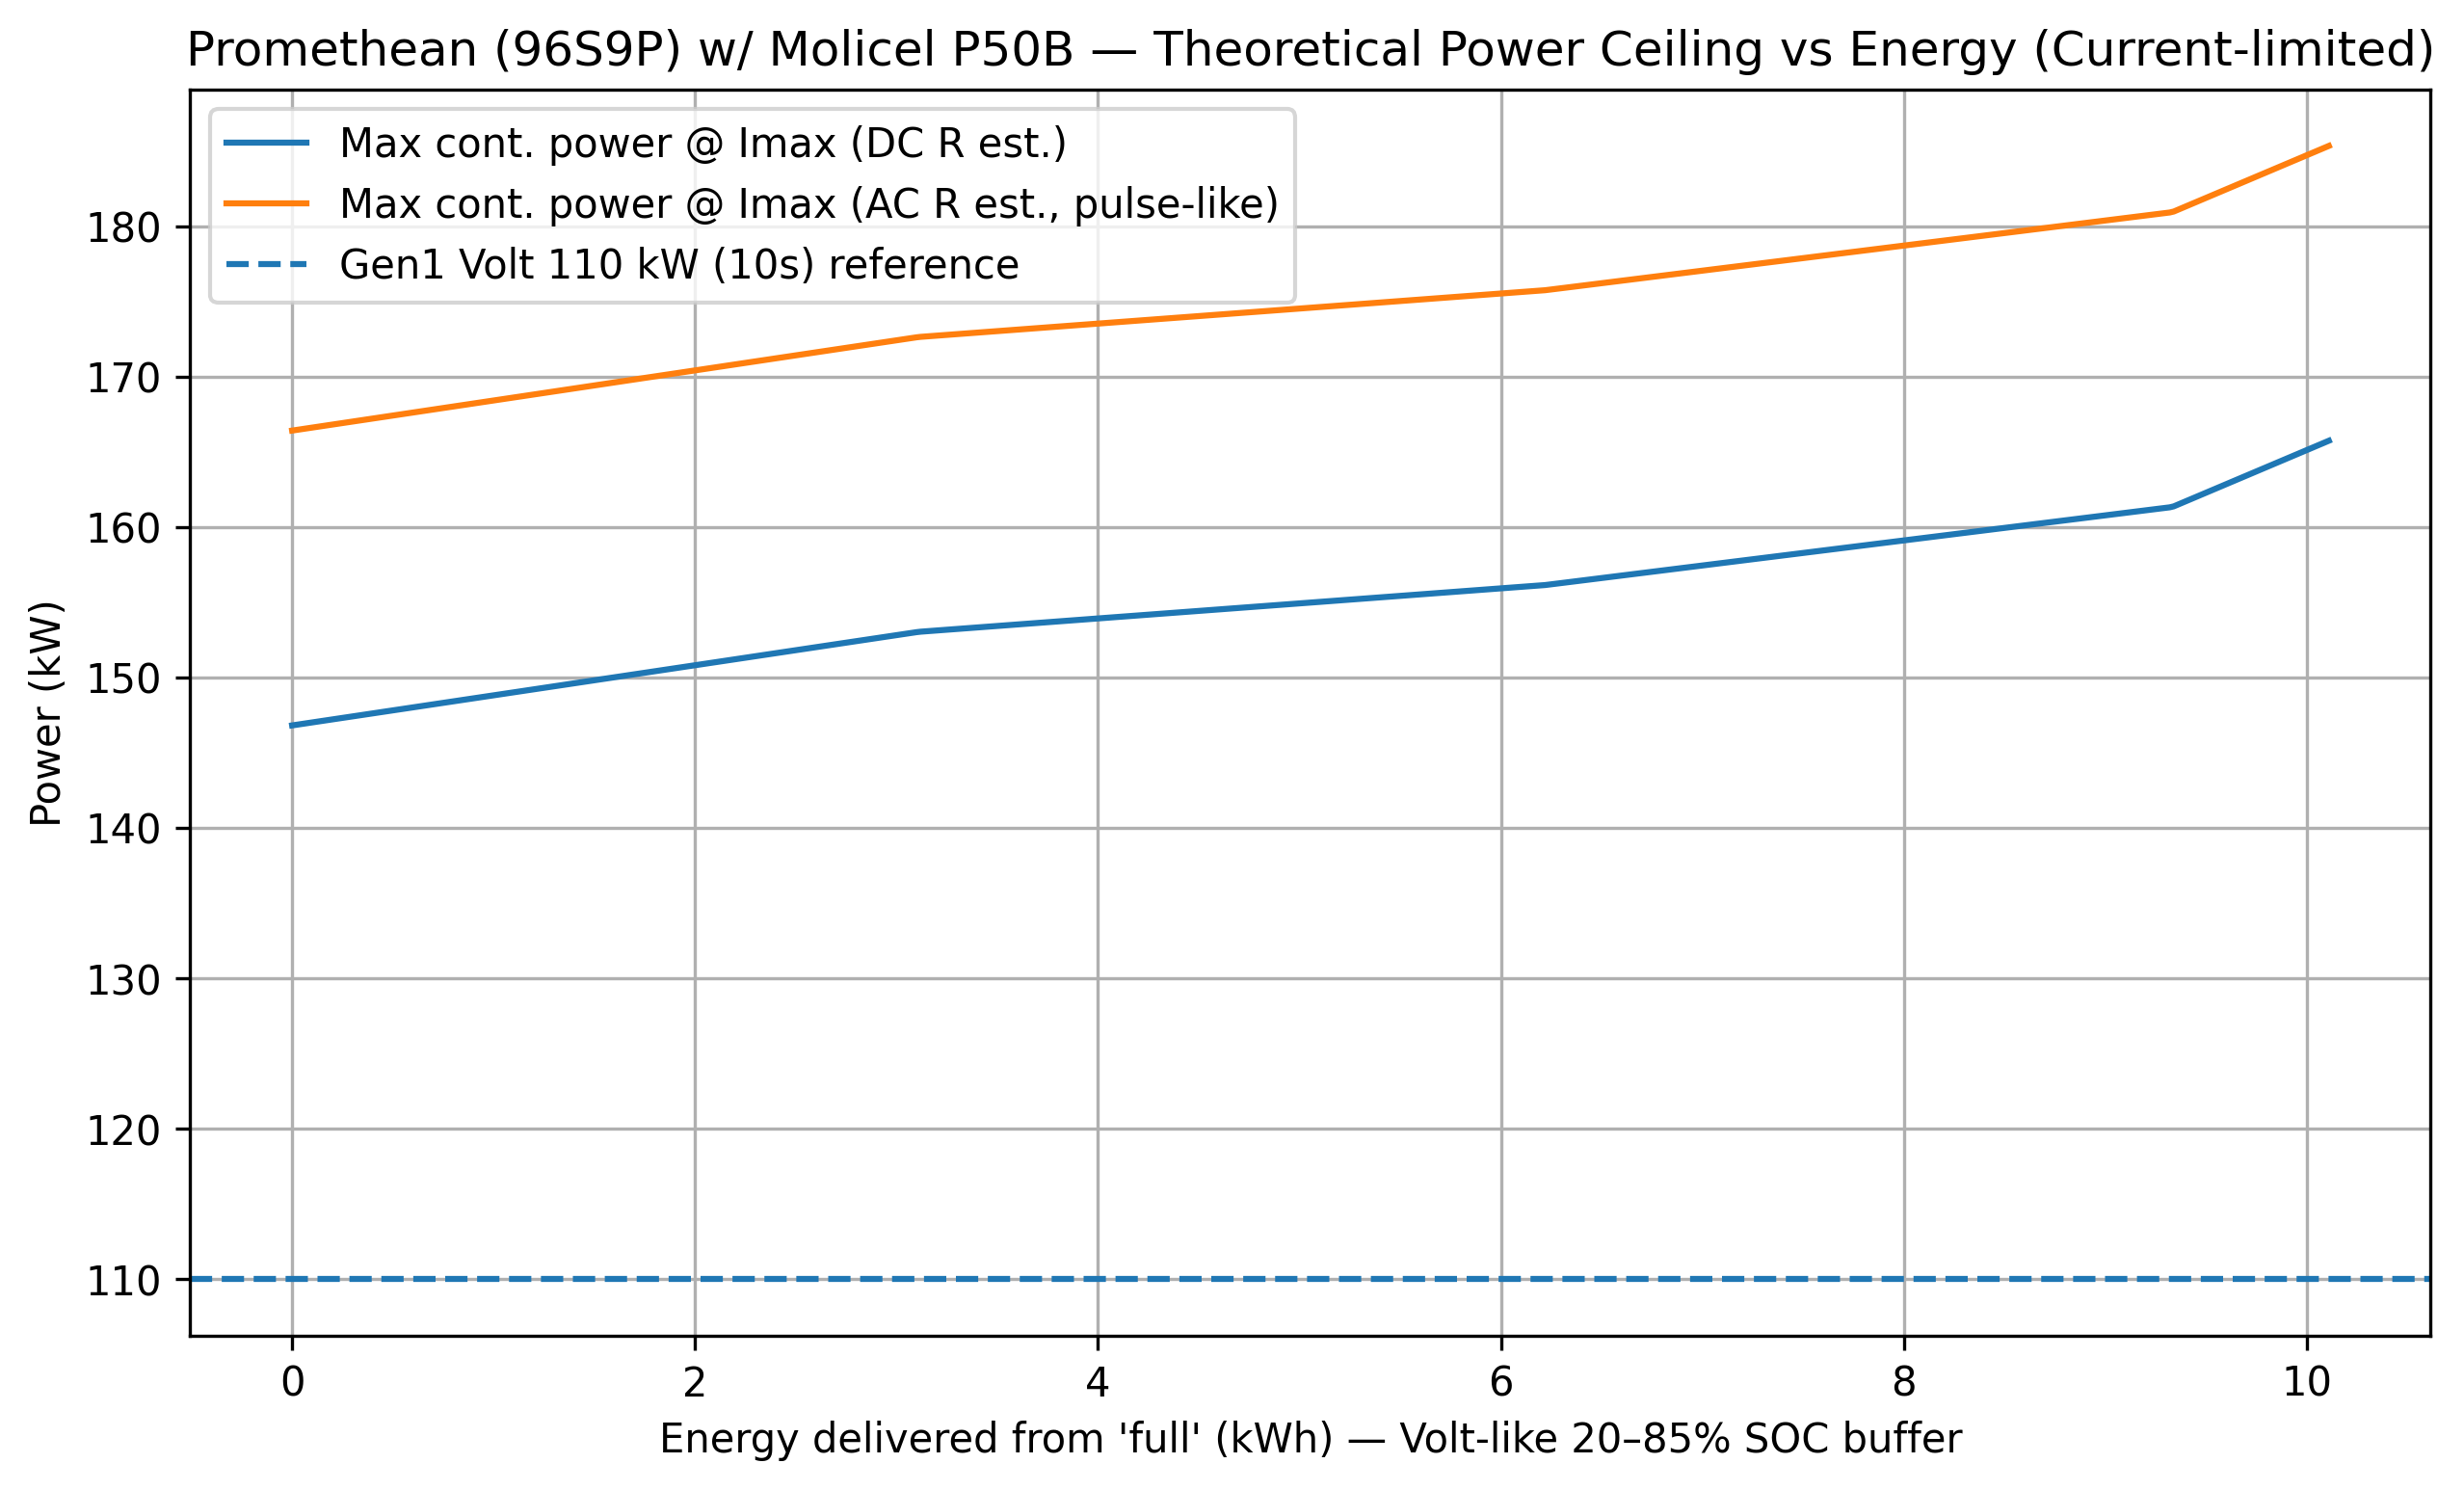
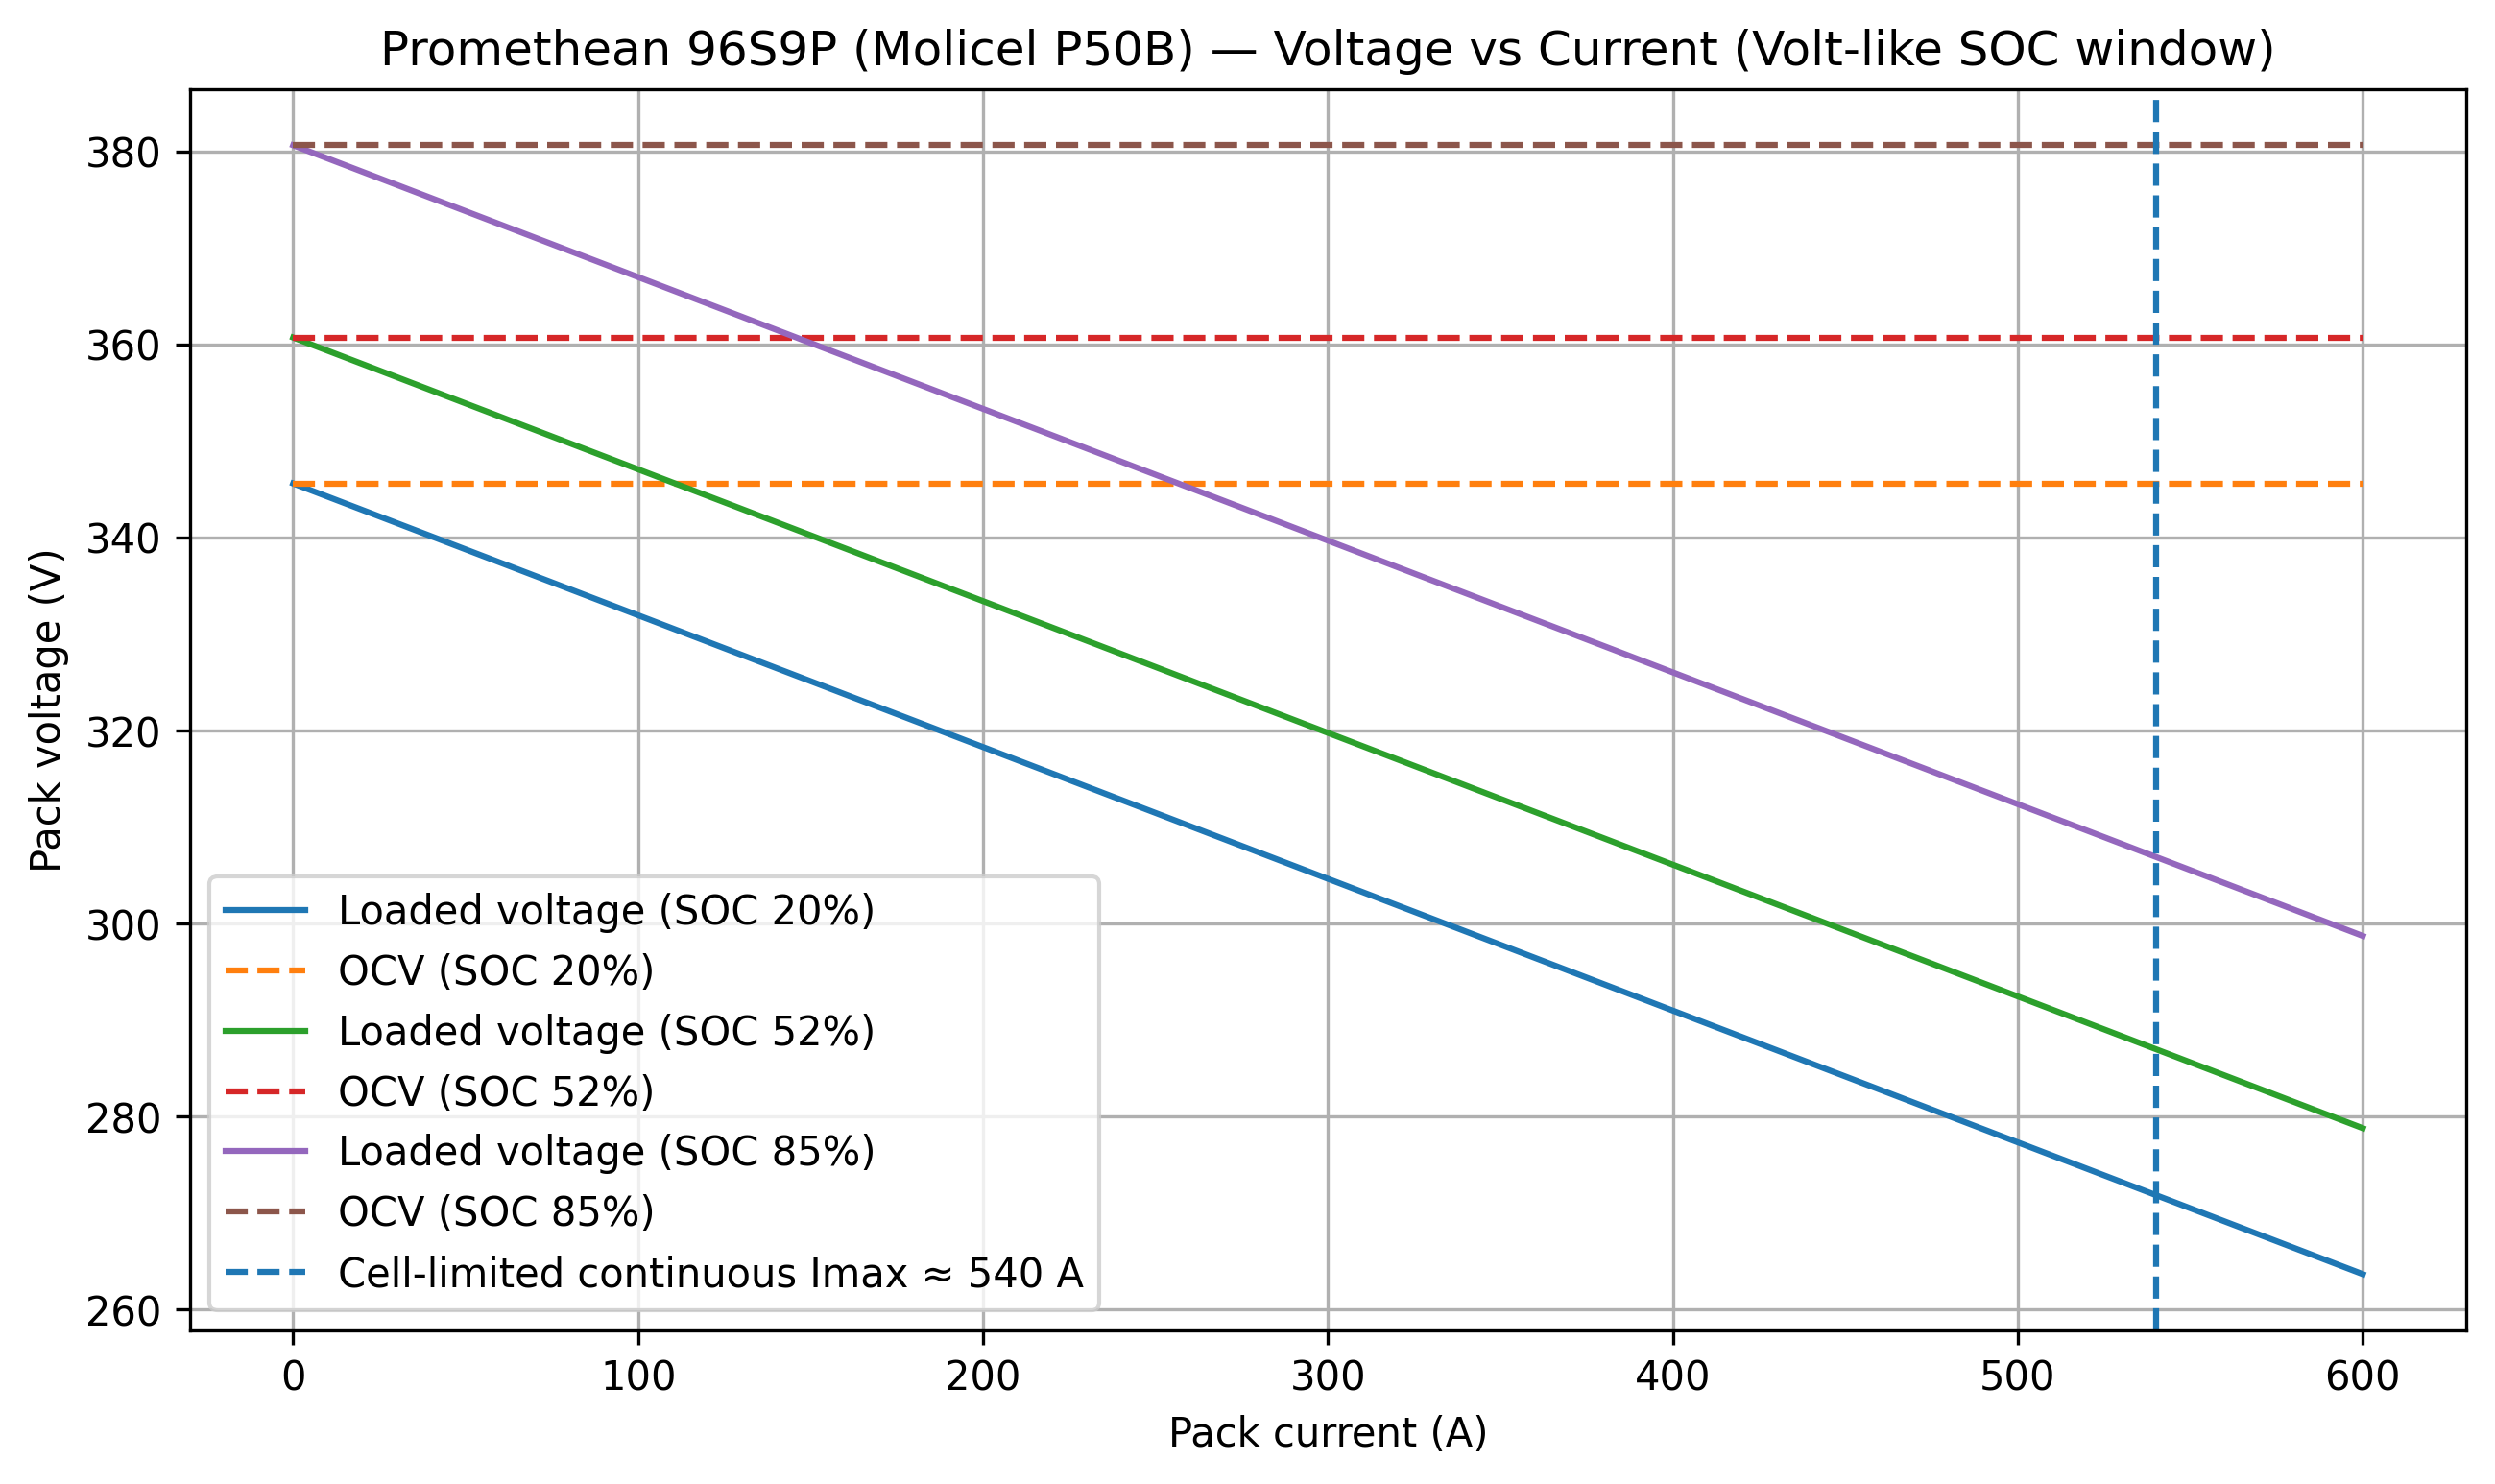
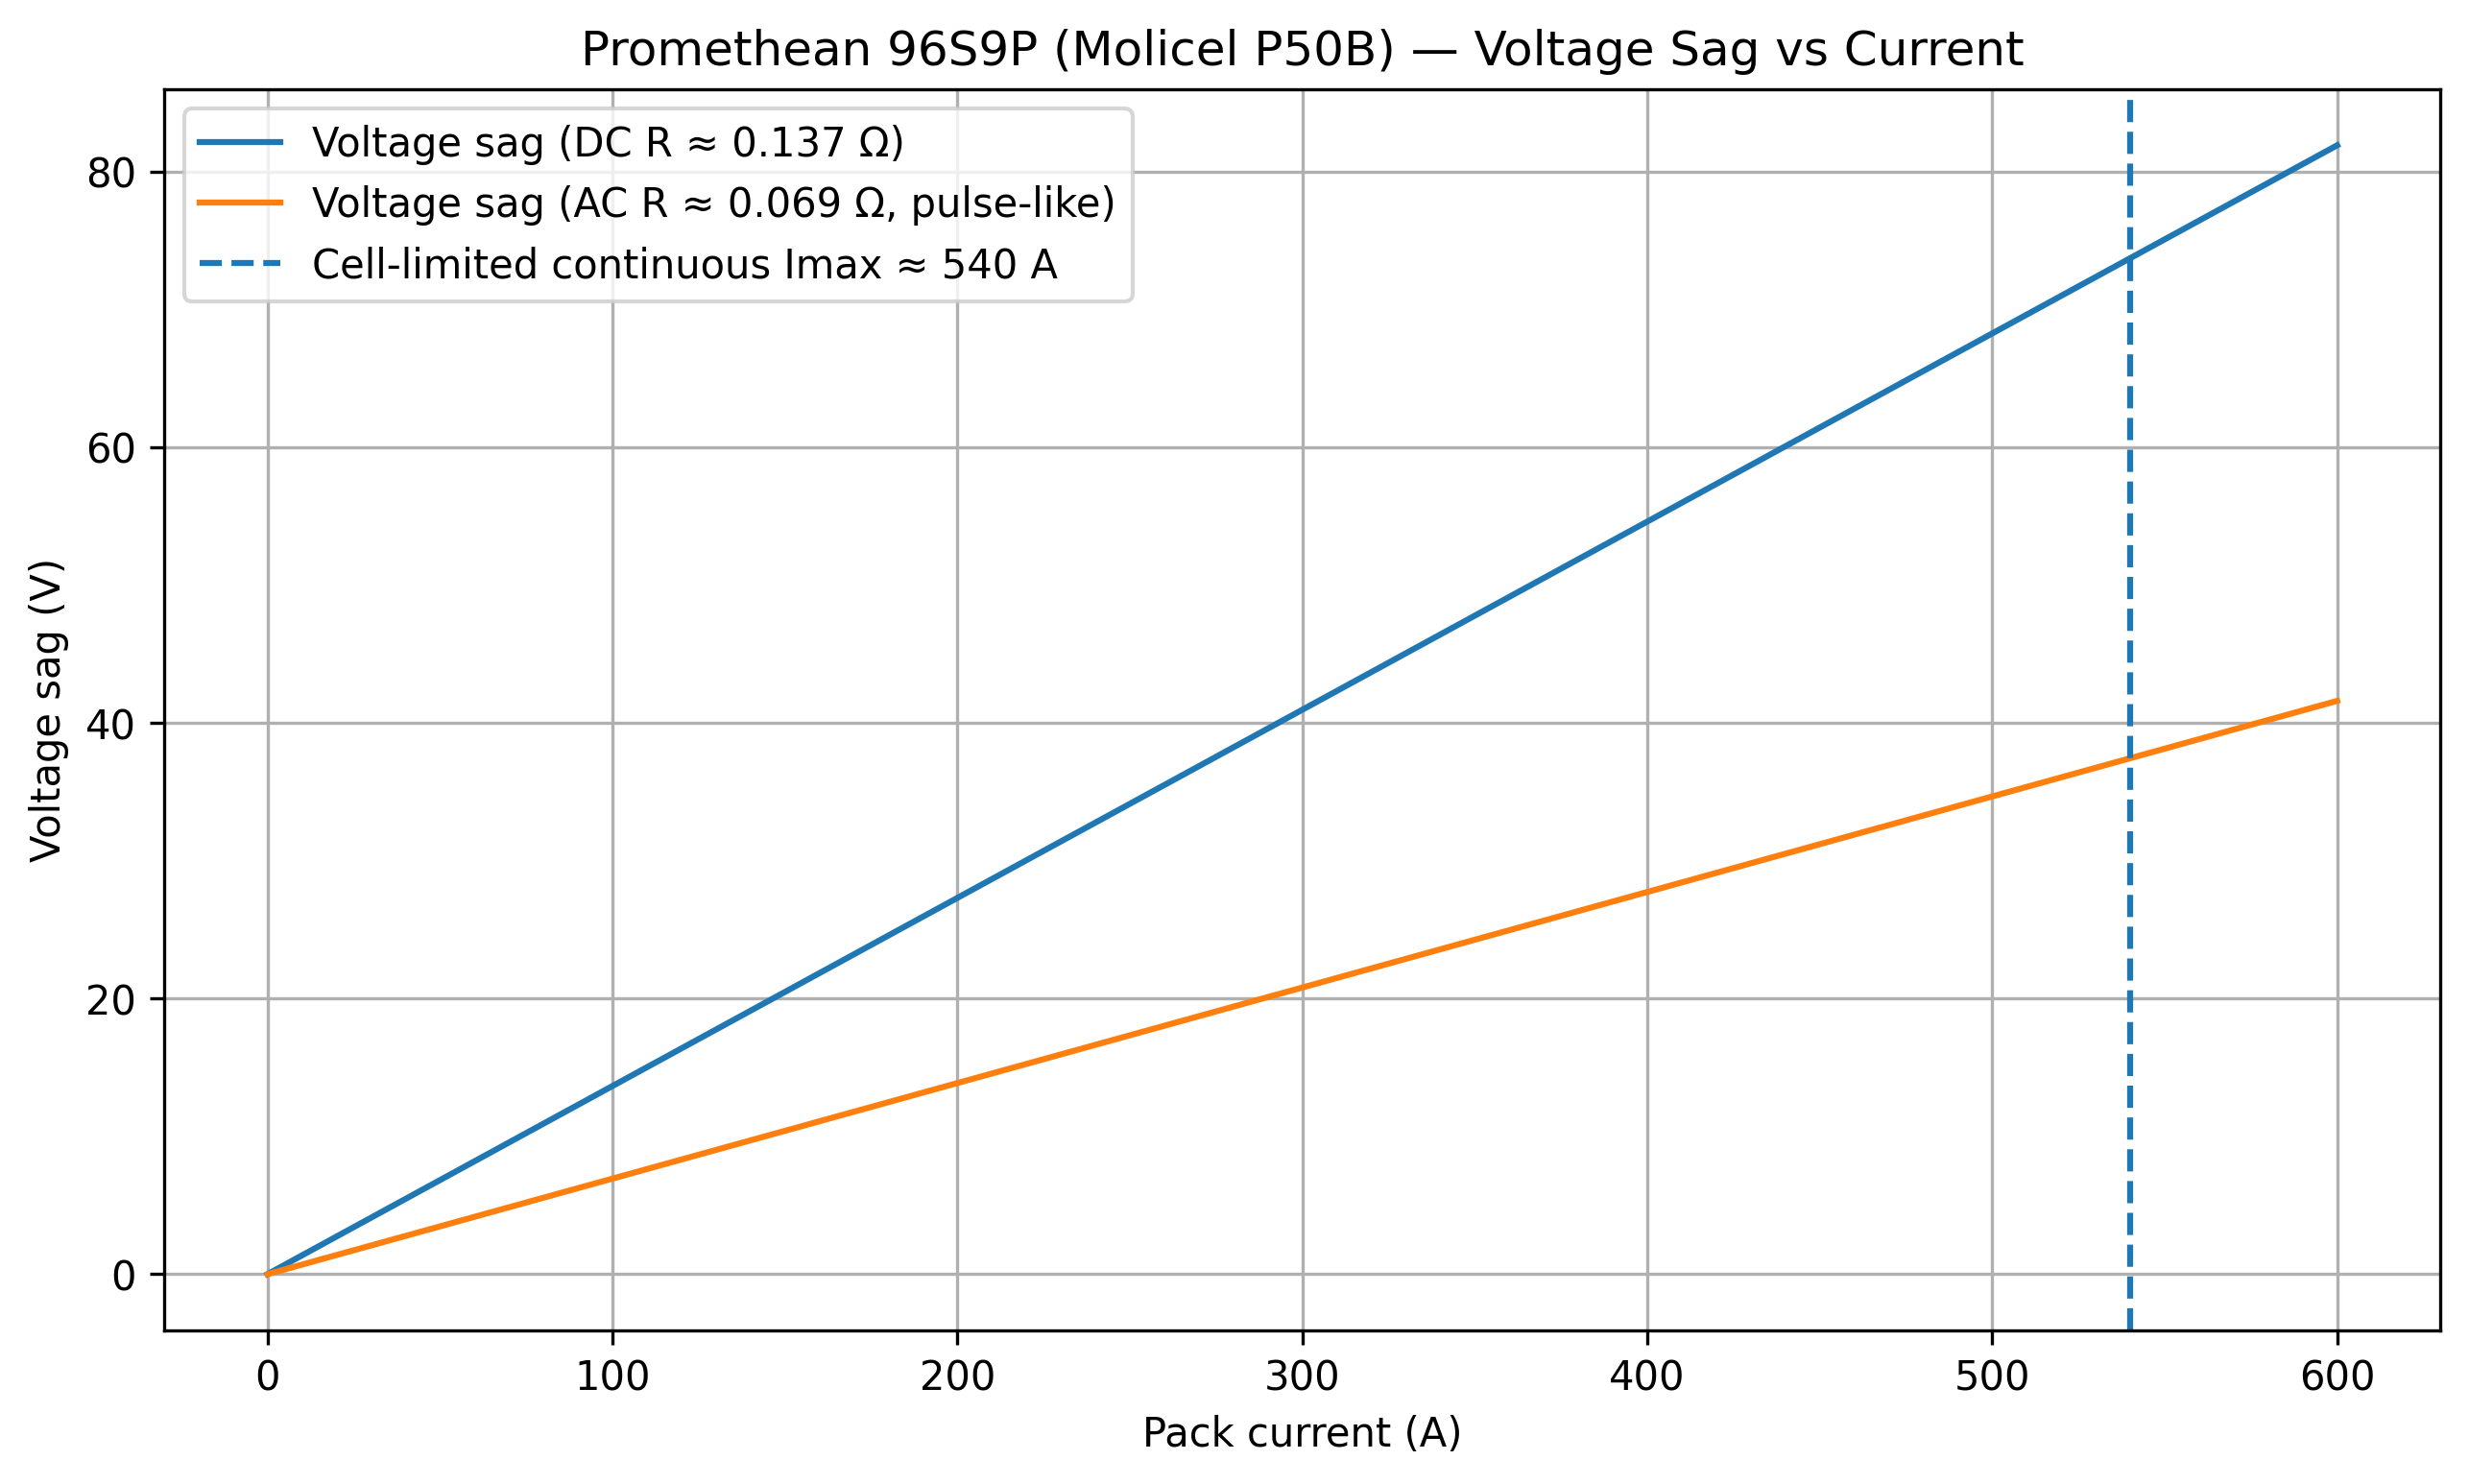
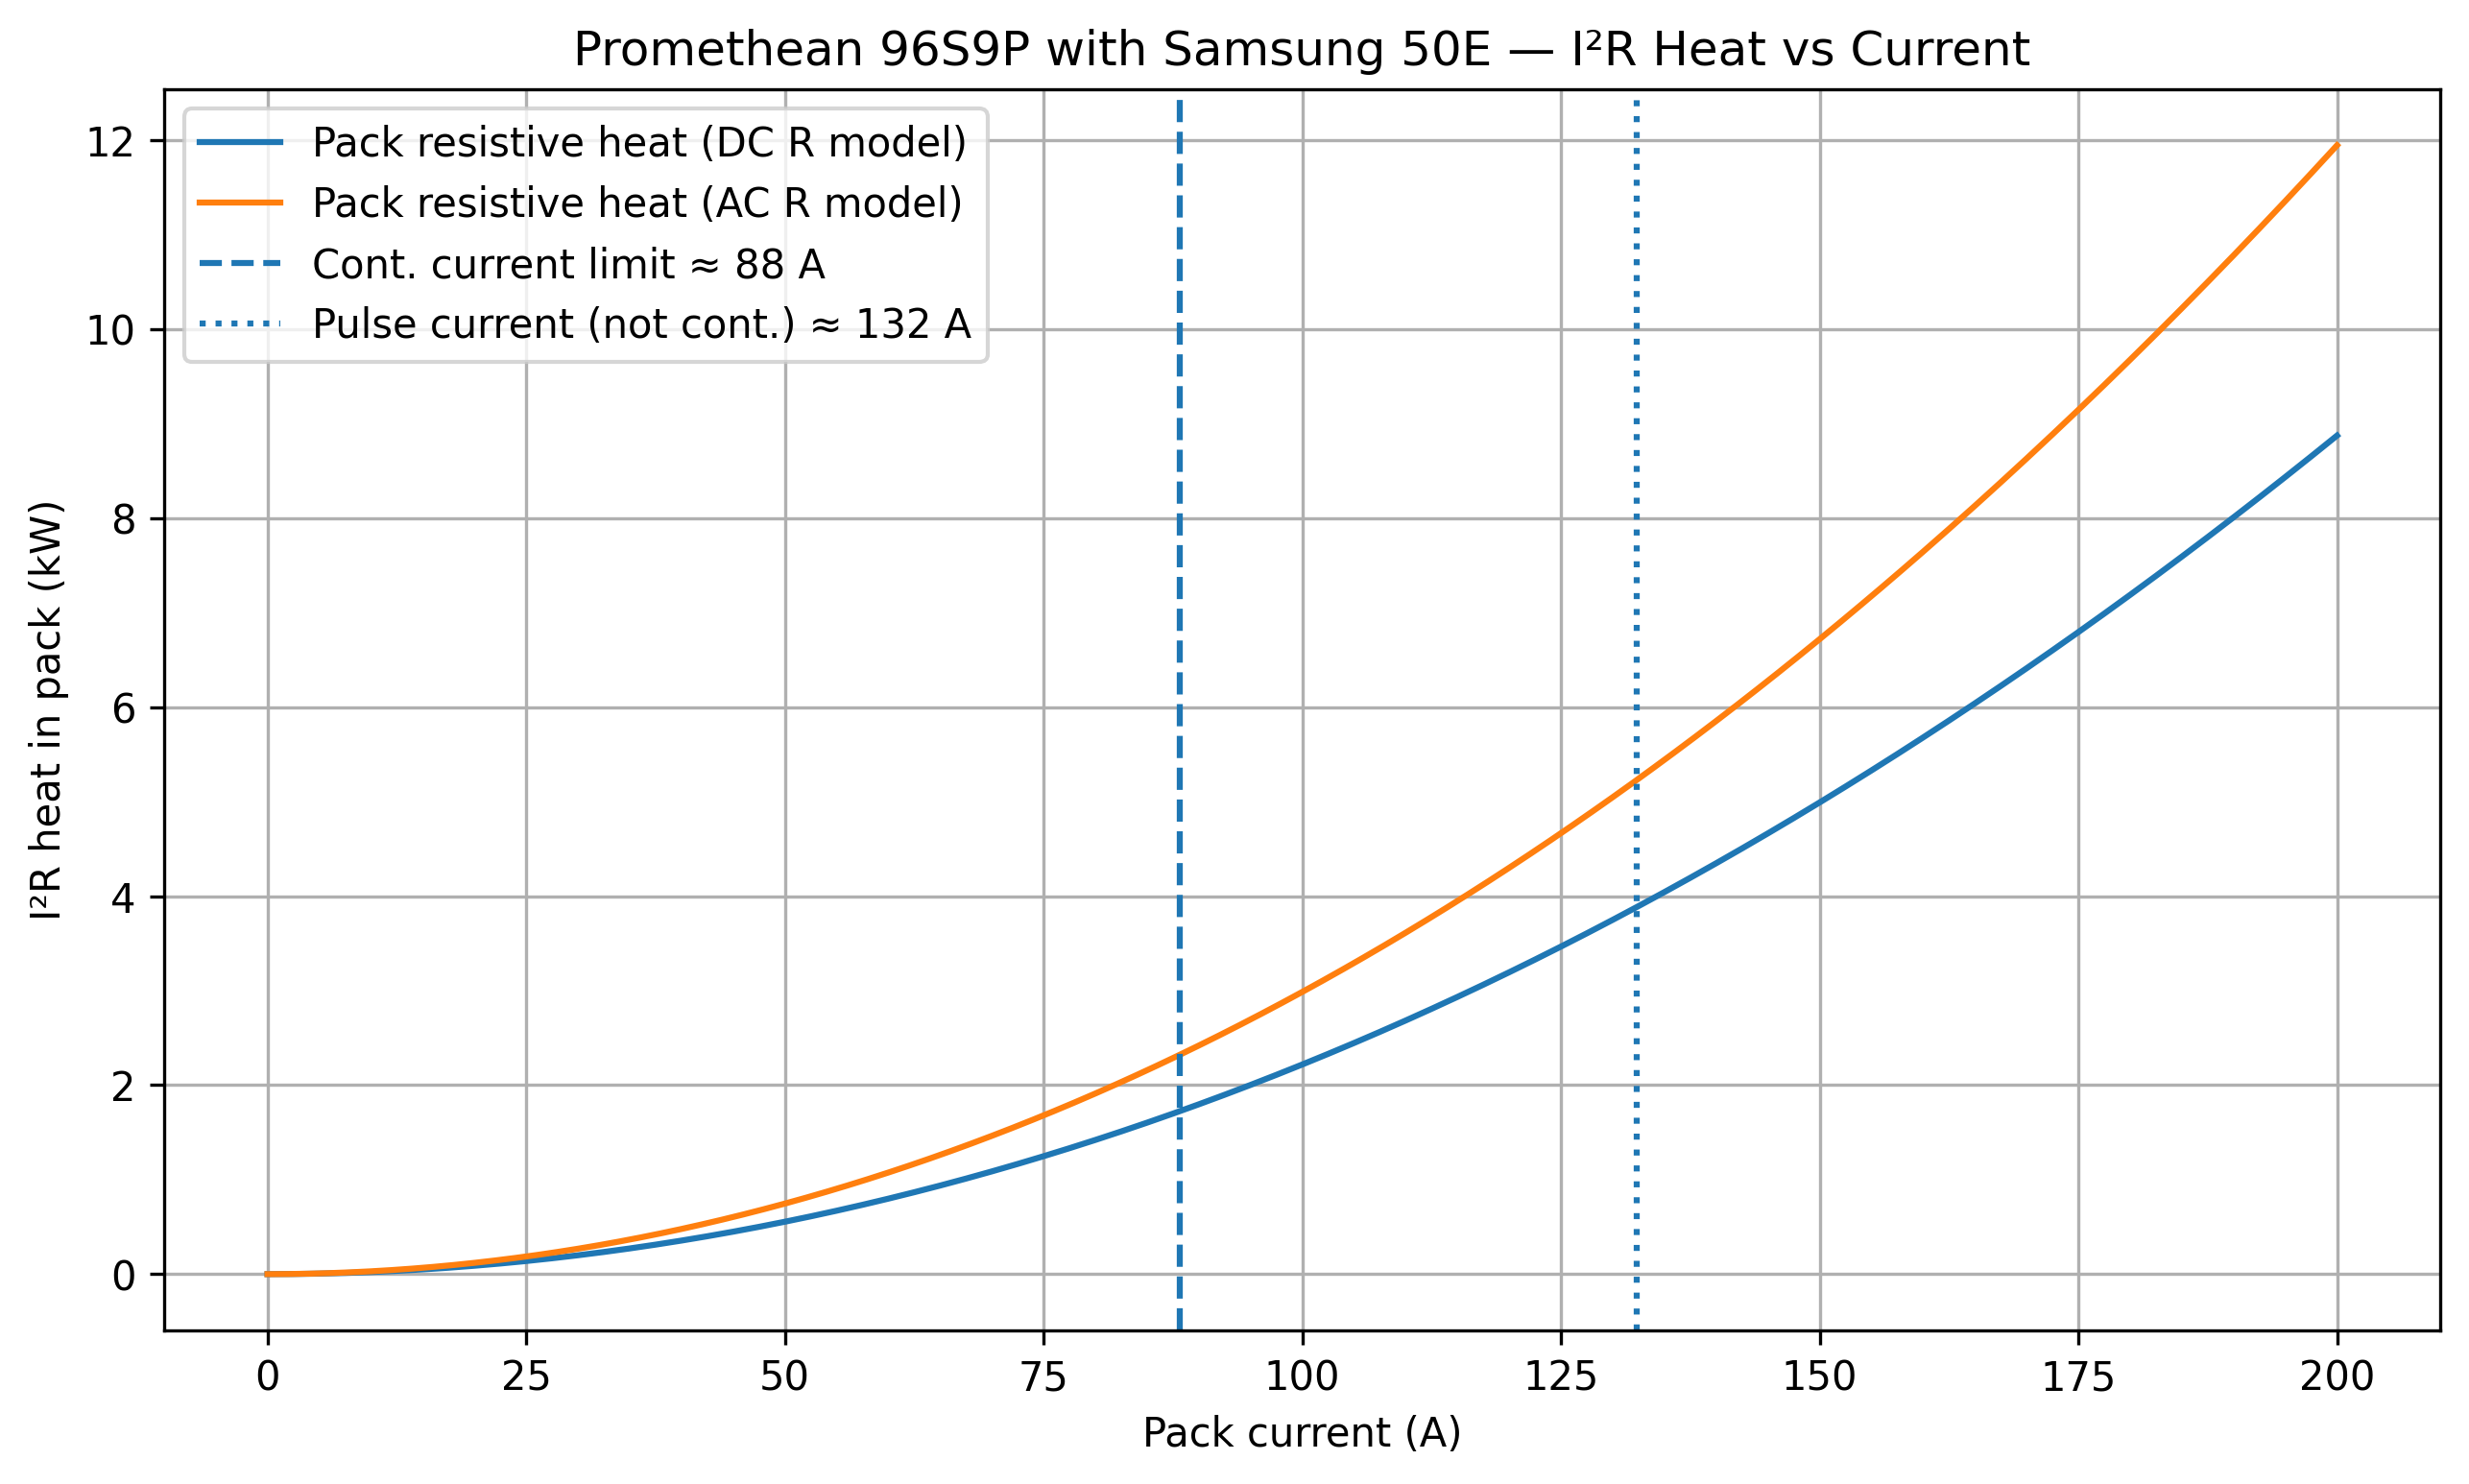
Cell characterization (P50B)
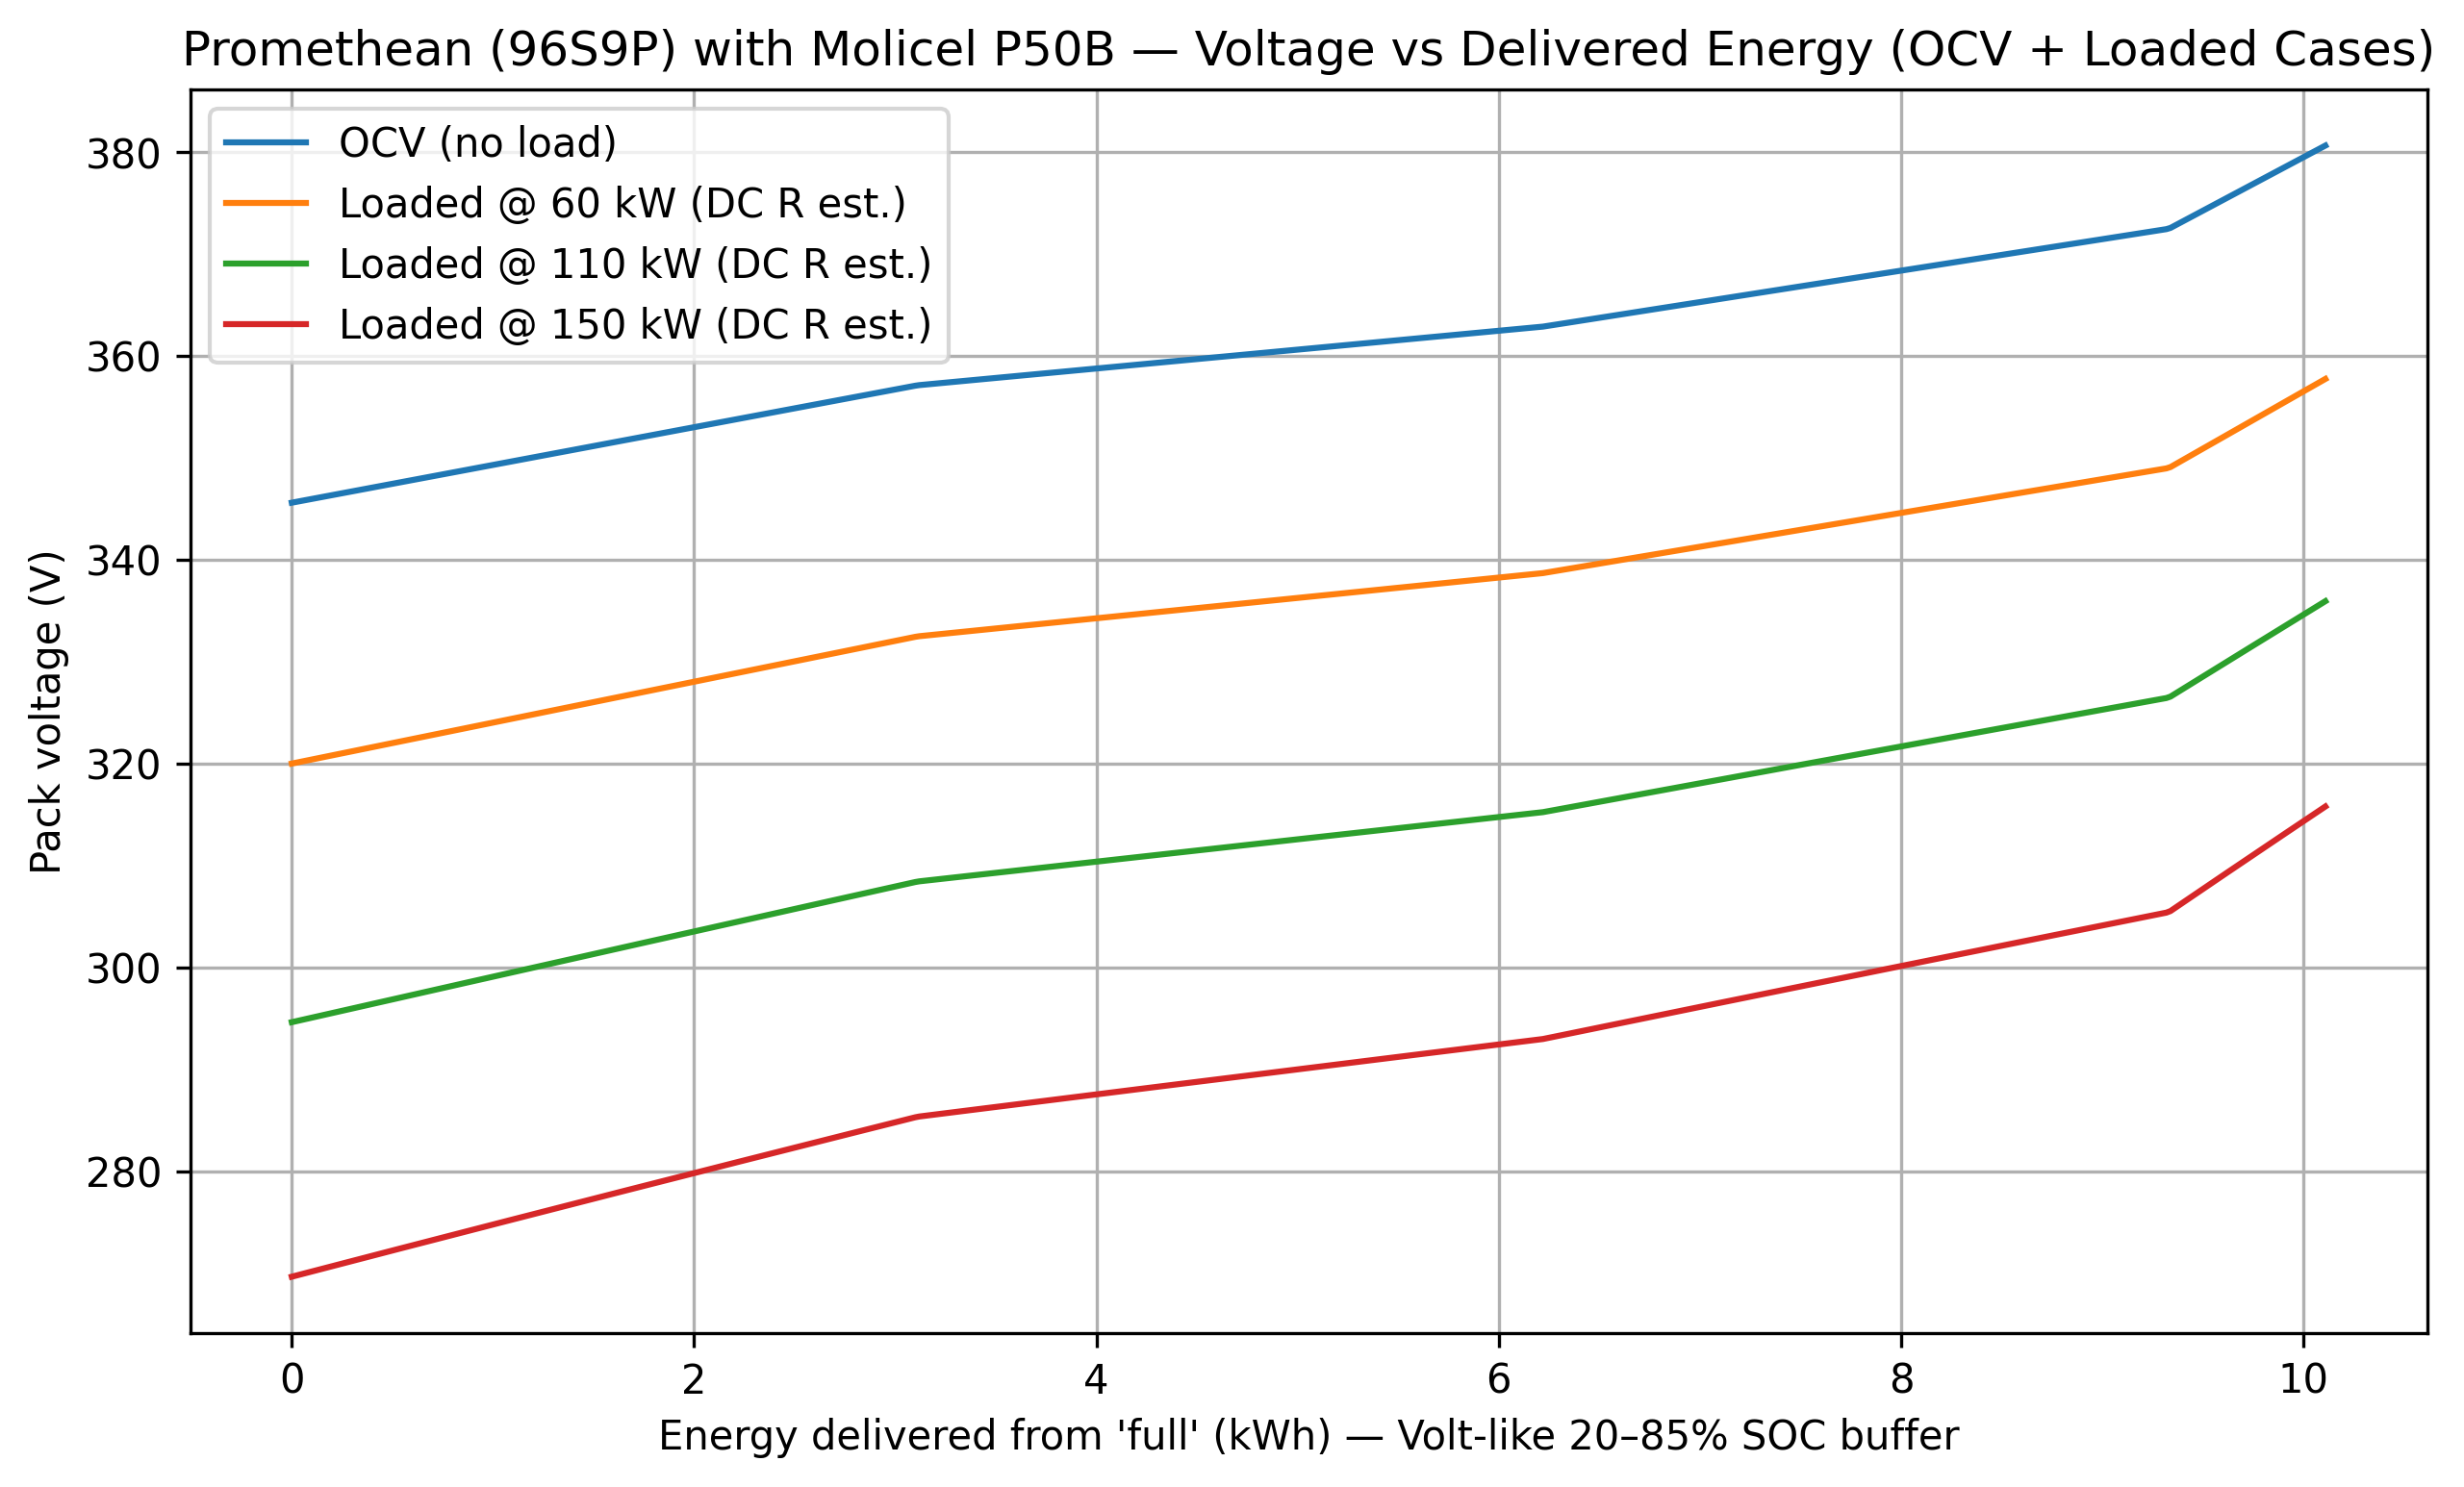


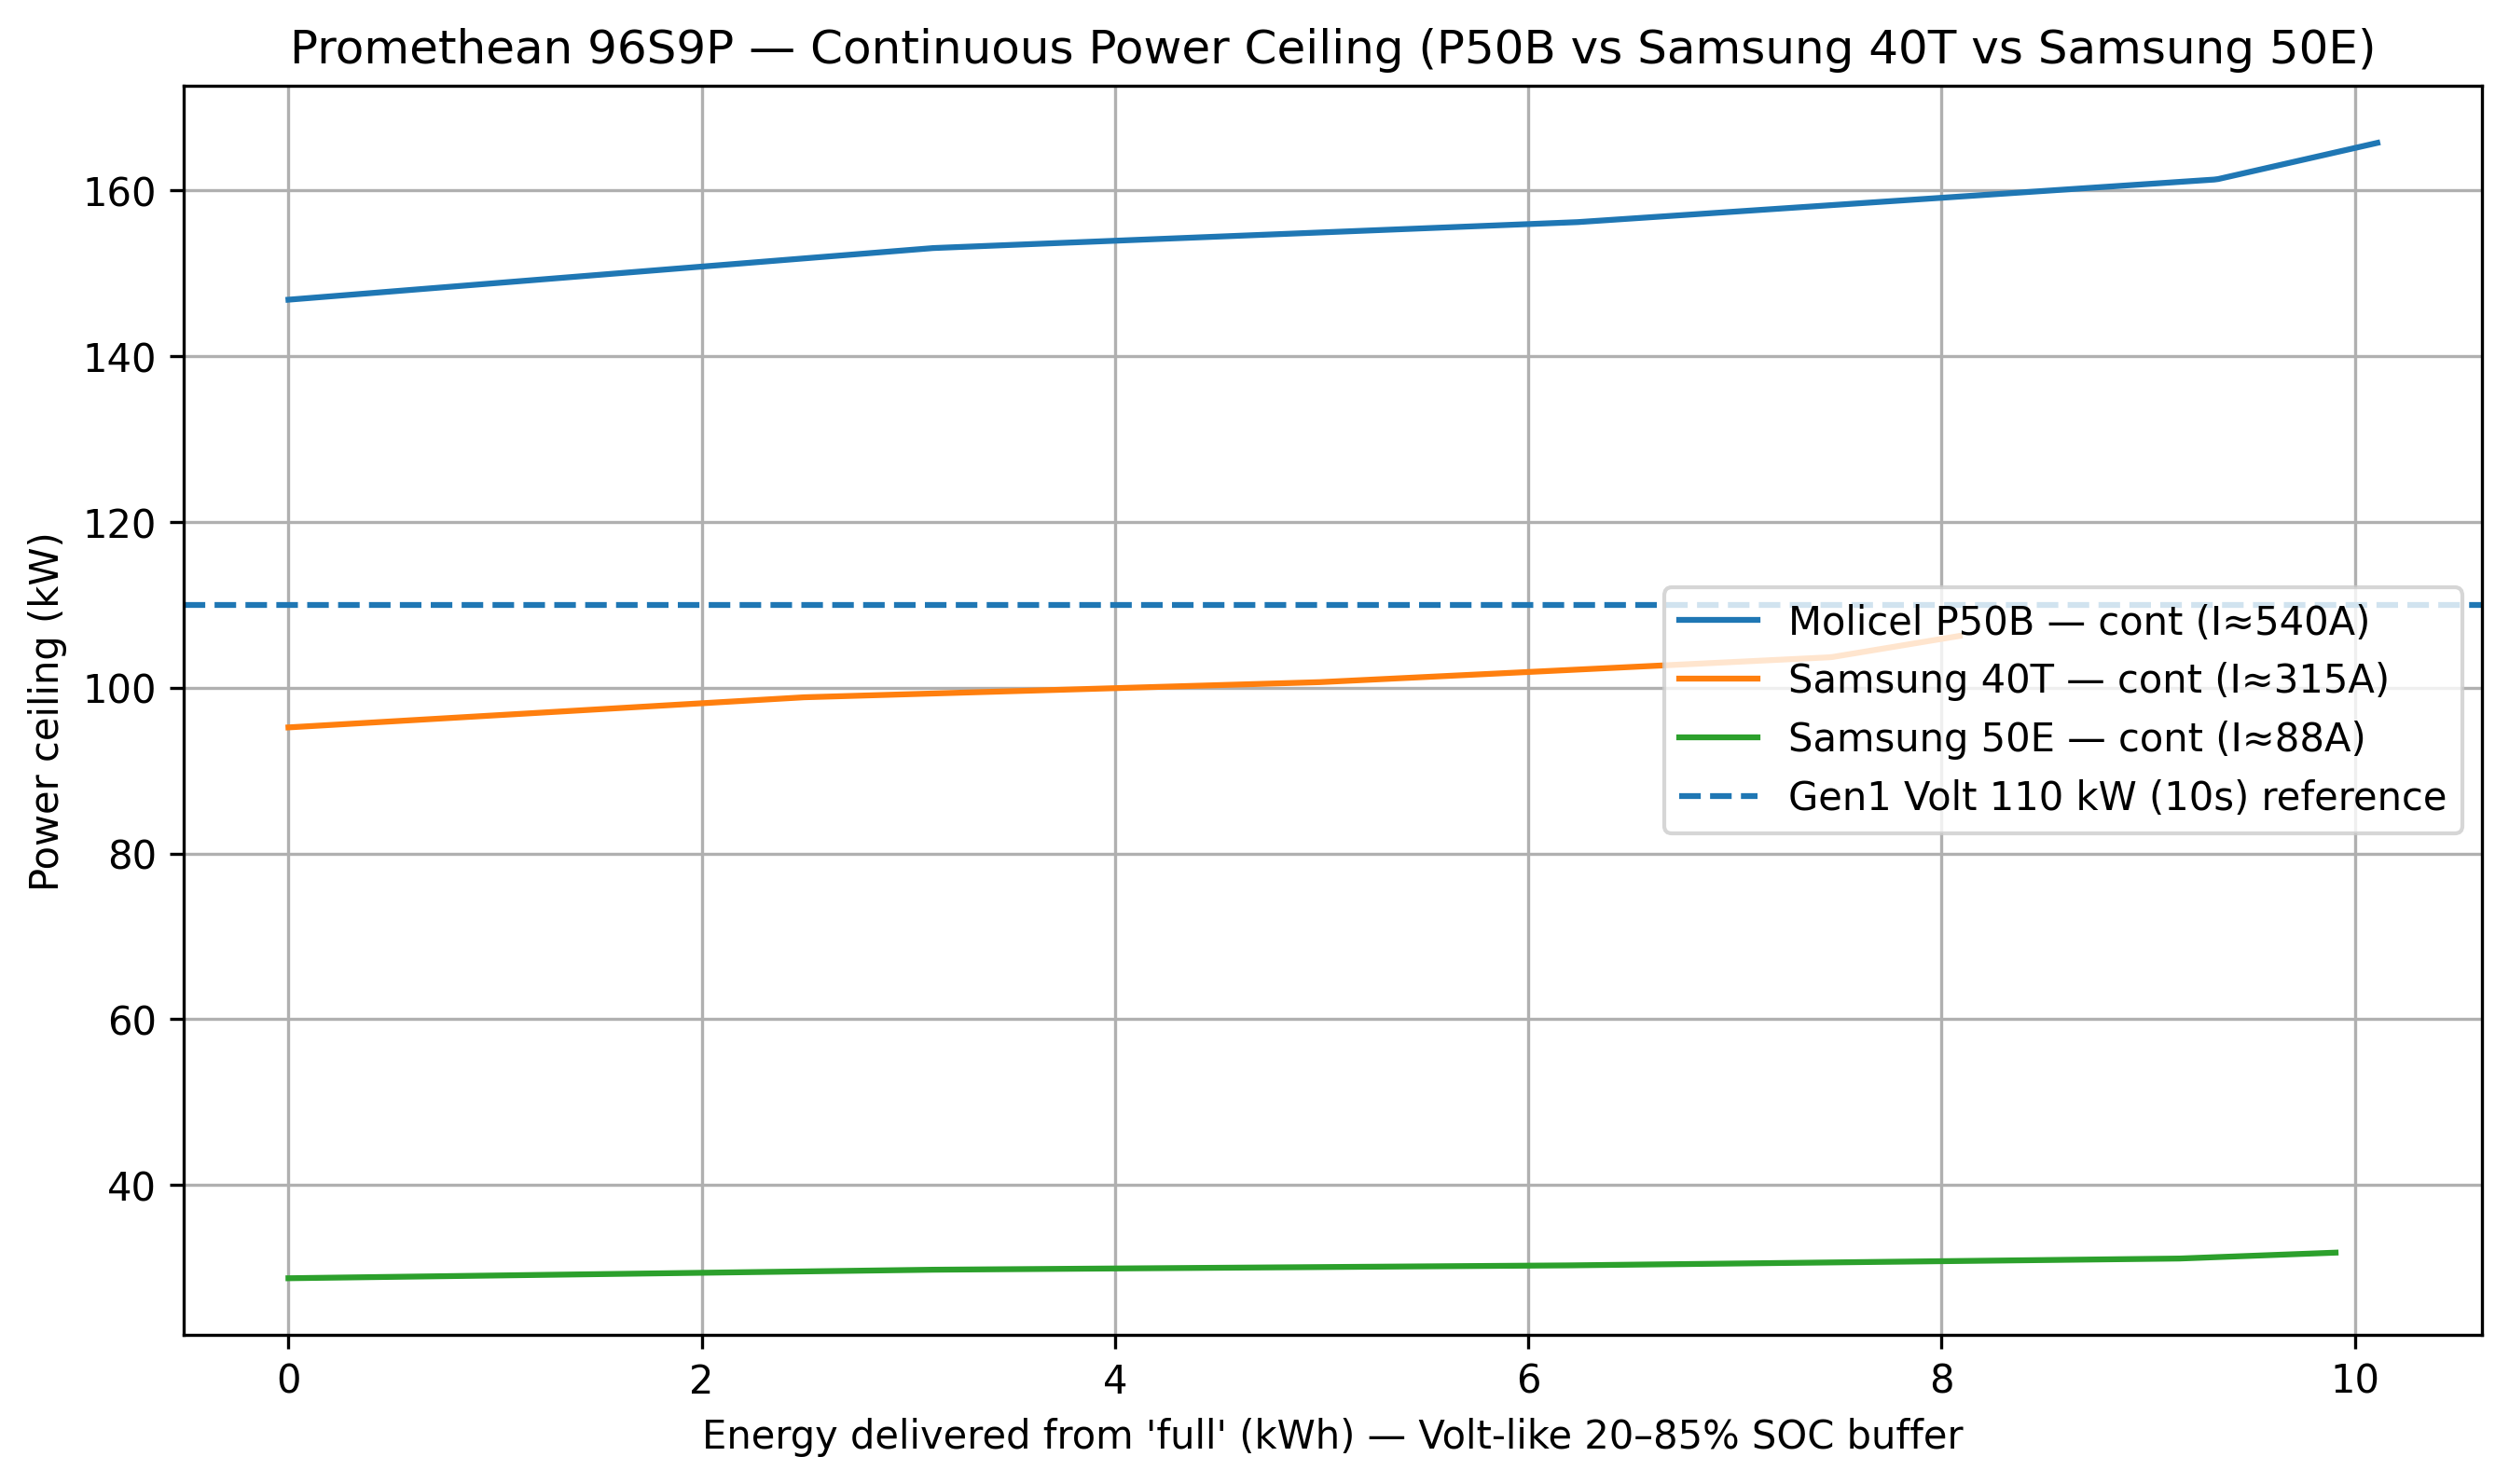
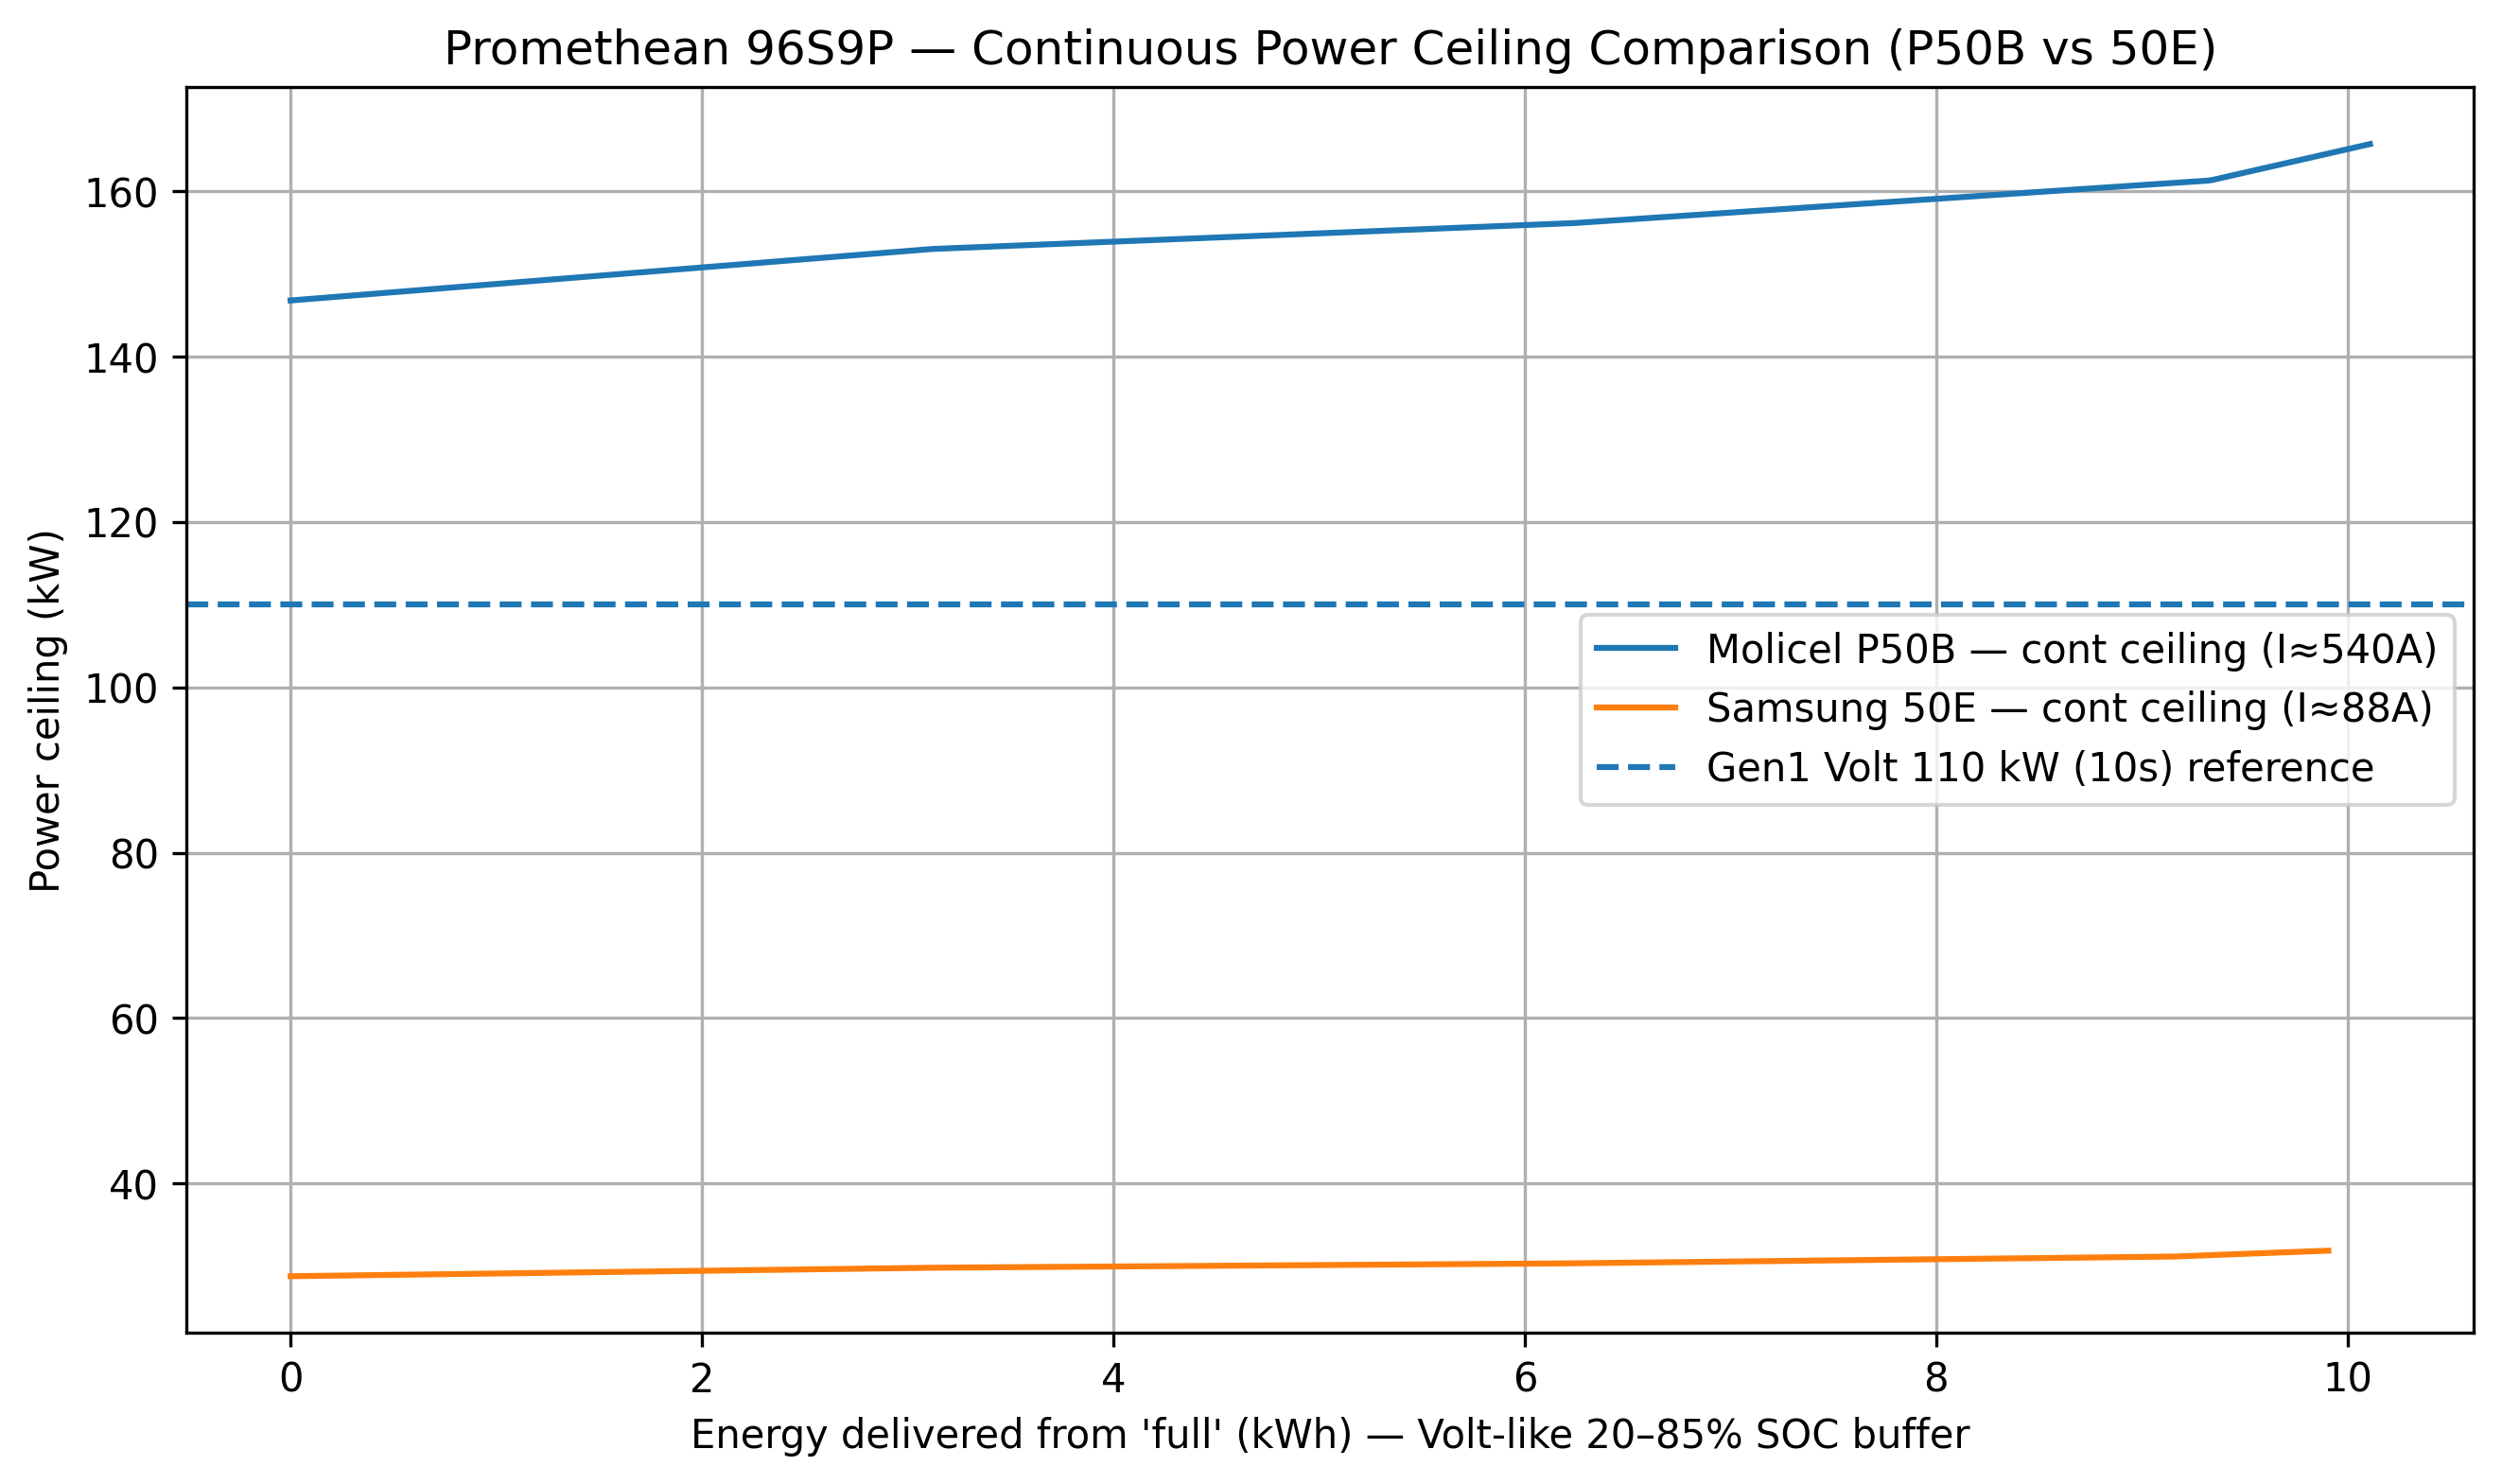
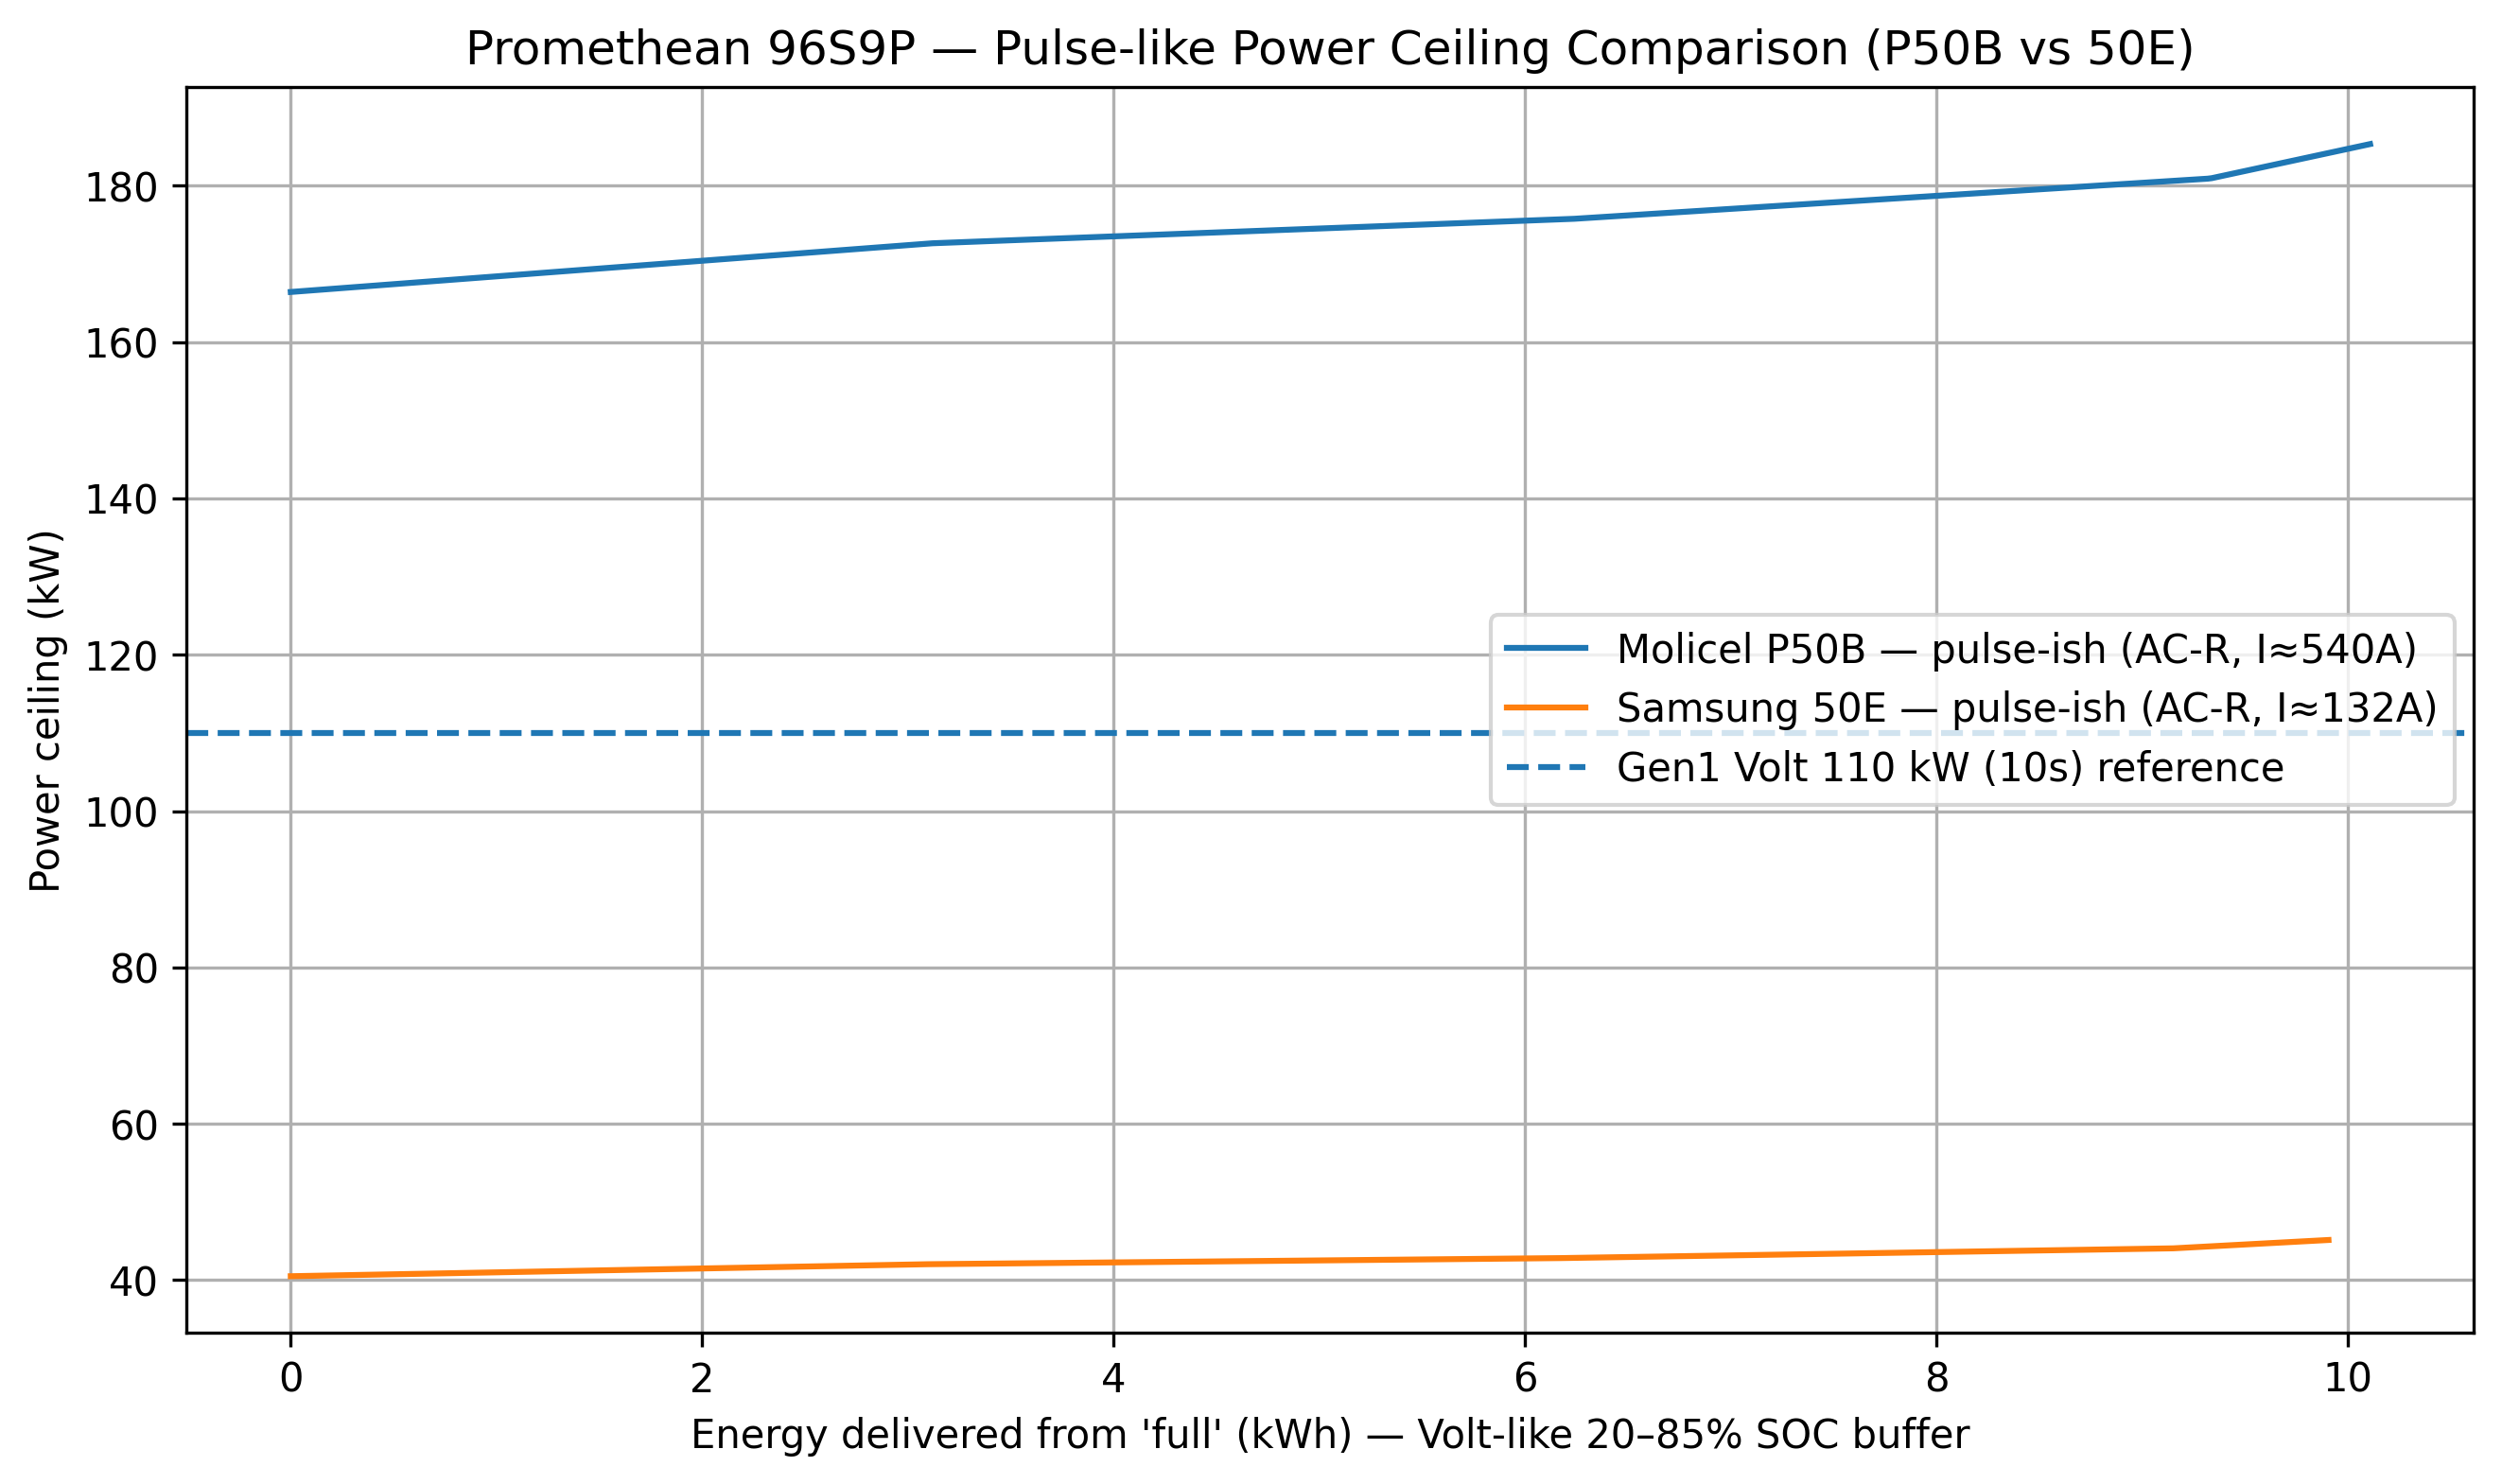
Continuous vs pulse behavior


Comparative stack ranking


Full pack download
One PDF with every graph, packaged for sharing.
This site is a static build designed for Porkbun hosting. Your shop photos and performance graphs are wired in.
© Promethean Batteries. All rights reserved.